
October 2019 Release!
EasyTerritory is excited to announce our October 2019 release. There are a number of enhancements included in the October release (v 3.64.03) that we know will be helpful to our EasyTerritory Users.
Enhancements to Partitioning
- Firstly, the October release features a new, 2nd-generation partitioning engine that is faster, and even better at clustering partitions to avoid overlap”
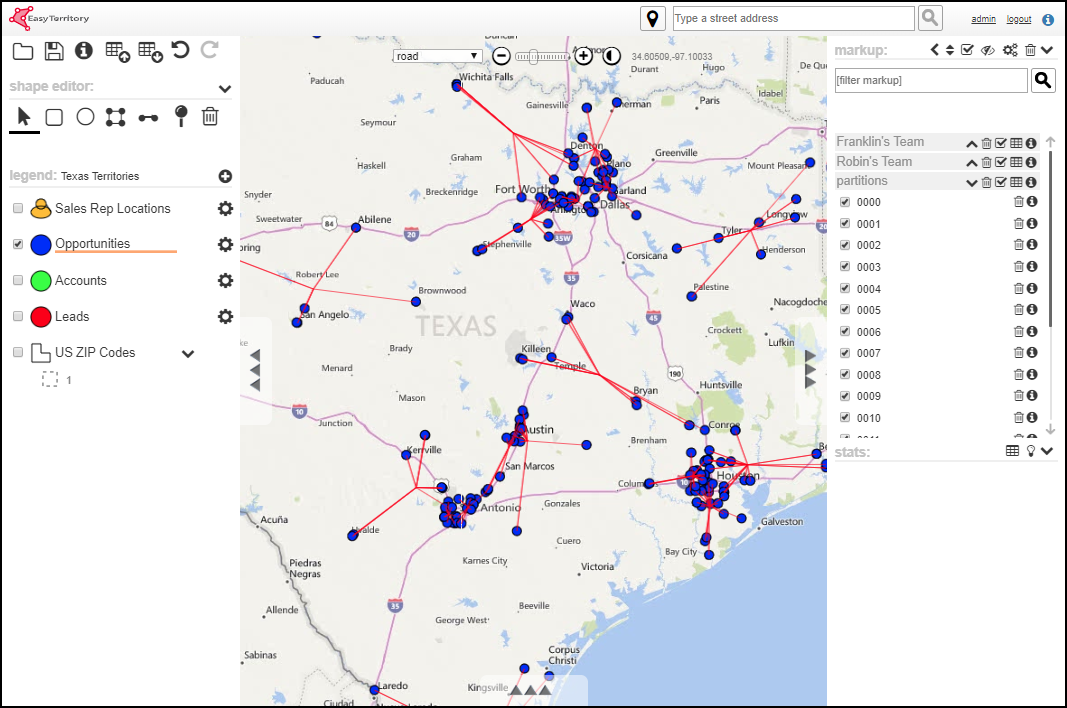
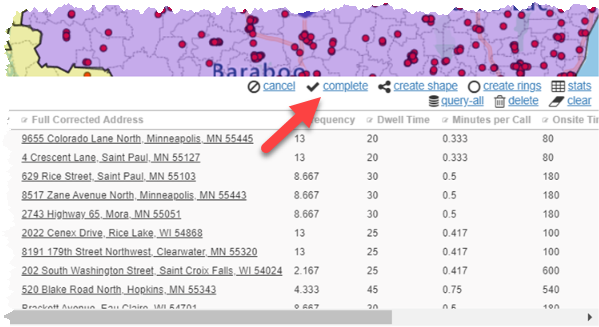
- Also, for those users who have large projects that require creating many partitions, with the new release there is also the ability to accept a partitioning solution while the partitioner is still running. If it seems the partitions are distributed as evenly or clustered as tightly as should be necessary and the user does not wish to wait for the partitioning engine to run its entire process, the user can simply click the “complete” icon in the results grid and accept the partitions as is:
Improvements to Scheduling
-
- The October release comes with imporovements to the scheduling engine, minimizing driving time while leveling workloads.
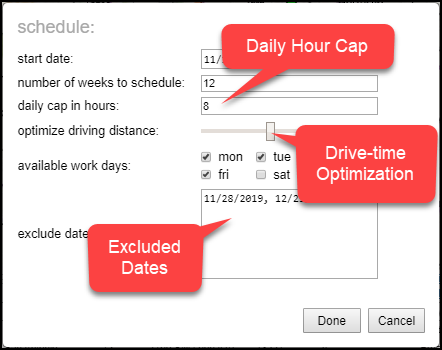
- There is also now an adjustable “driving distance optimization” slider, which allows the user to choose the balance between having the shortest possible drive time for each route created and keeping as accurately as possible to the schedule. There is also a “daily cap in hours” feature, which in case the user has a hard maximum number of hours per scheduled route that cannot be exceeded. There is also an improved process for handling exclusion dates:
- This release includes a new feature that, when a point from a different layer gets added to a partition, the added point automatically becomes the starting point when the points get routed. This feature is especially helpful when a sales rep or service tech wants to add an address from one layer, perhaps a home or warehouse address, to a list of contacts they will need to visit.
Updates to the Data Grid
-
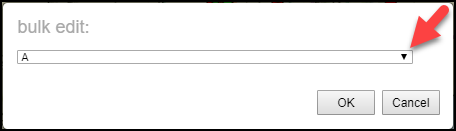
- When using the “bulk edit” feature in the data grid, there is now a convenient drop down feature which allows the user to select the updated entry for the column he wishes to edit. This feature not only helps with speed and convenience, but also helps to prevent human error by removing the need for the user to type in the updated column information. Remember, to access the bulk editor, the user simply needs to click the edit icon next to whichever column in the data grid he wishes to edit:
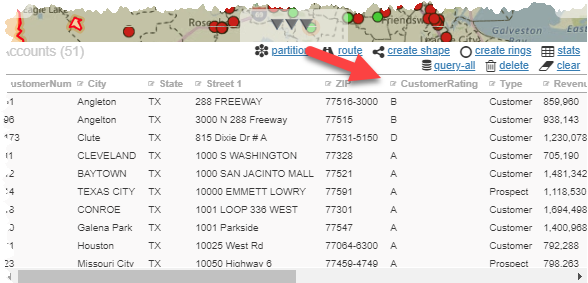
The drop-down callout will appear, allowing the user to select what the new entry will be for that column in all of the points in the data grid:
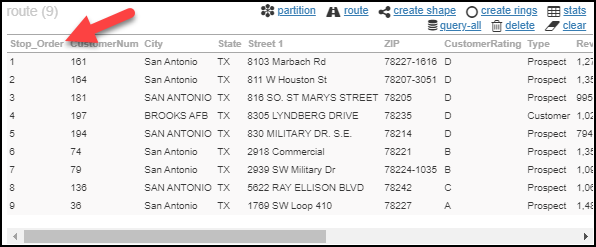
- Also, when viewing a route in the data grid, with the October release there is now the ability to reverse the stop-order of the points on the route. This can be done simply by clicking “stop_order” on the data grid. A new route will be created, starting what was previously the final stop and ending with what was previously the first stop:
Other updates
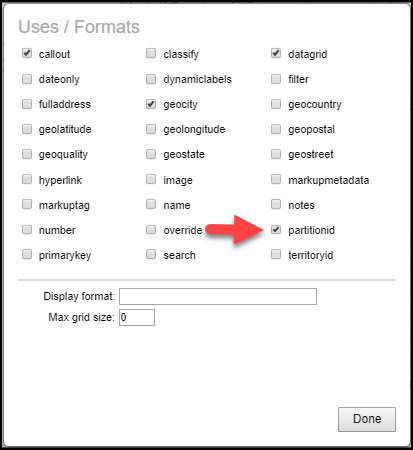
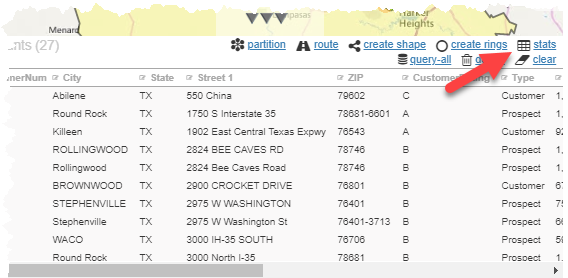
- The user now has the ability to show statistics just for points in the data grid based on whatever column in the data they wish. To use this feature one column in the data must be flagged as the partitionid:
A “stats” icon will appear in the data grid:
And the user will be able to see the statistical results based on the column that was selected:
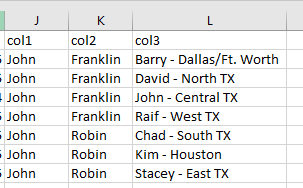
- There is also an enhancement in exporting data, one that divides any hierarchy in markup groups or markup names that are pipe-delineated into separate columns in the exported geoJason or spreadsheet. Where previously the user would only receive the markup name and markup group in their own columns:
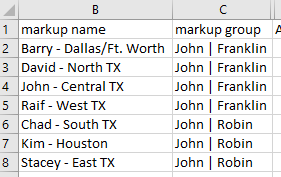
They now will additionally receive the pipe delineated labels in separate columns:
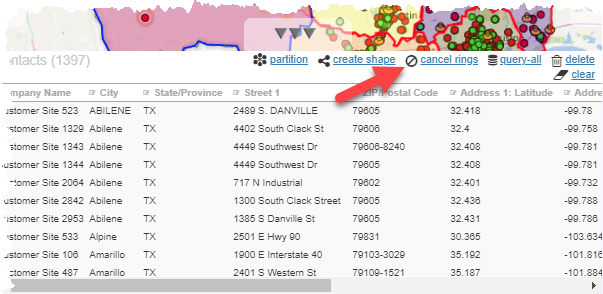
- The October release also includes the ability of the user to cancel the creation of multiple travel-time rings in the middle of the process. This cancelation functions the same way a cancelation of the partitioning engine works. The user can simply click the cancel icon in the data grid while the travel rings are being created:
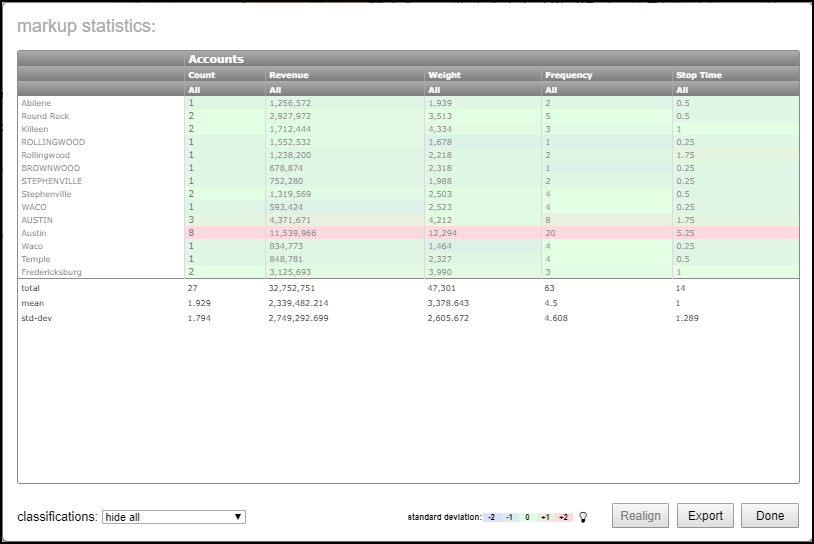
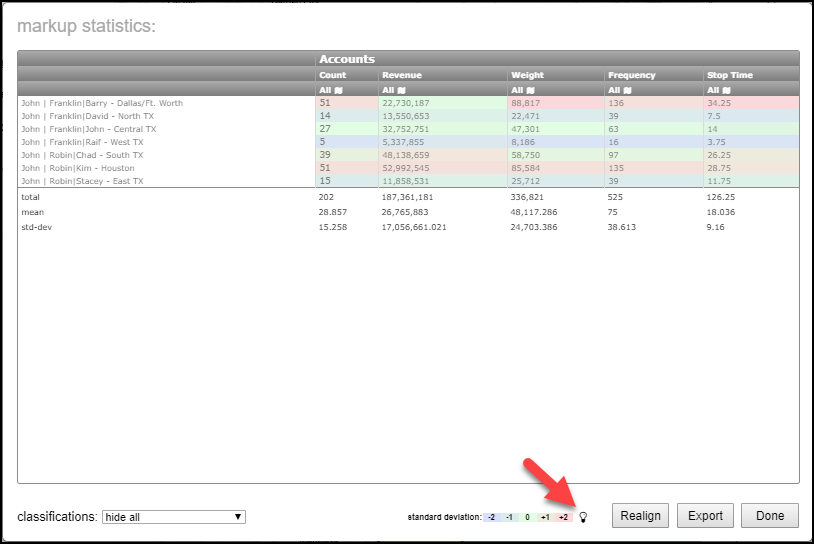
- There is also a new color-analysis mode in the all stats panel. Where previously only the standard deviation was shown via color highlights:
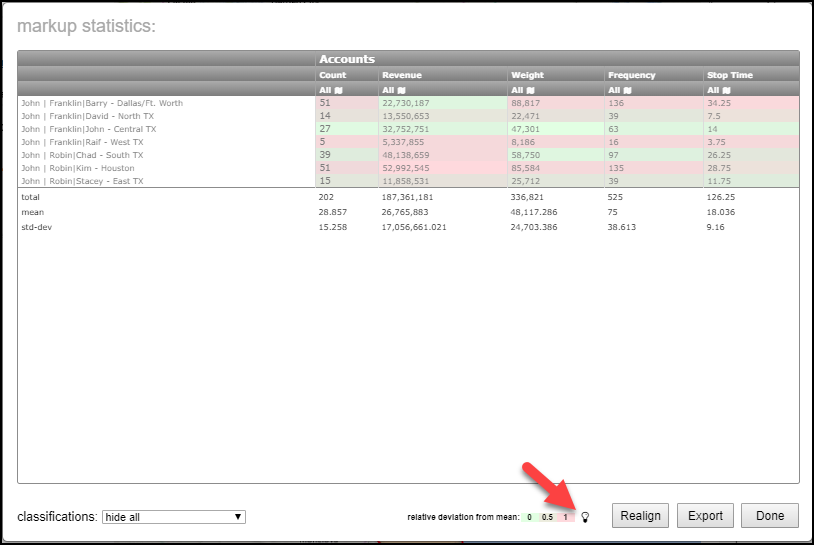
Now, by clicking the lightbuld icon at the user can switch to viewing a color-coded shart showing relative standard deviation from the mean:
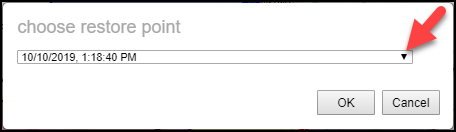
- And lastly, for those who use EasyTerritory’s “Restore Point” feature, which allows the user to restore the territories to where they were the last time a restore point was added, there is now a report available so the user can view the changes made to the territories since any previous restore point was created. The report does not need to be dating back only to the most recent restore point. The user has the opportunity to select from a drop-down whichever restore point from which he would like the report generated:
To find out more information regarding these, or any other features that EasyTerritory has to offer, or if you are ready to upgrade, or wish to sign up for a free trial, please contact us at sales@easyterritory.com.
