
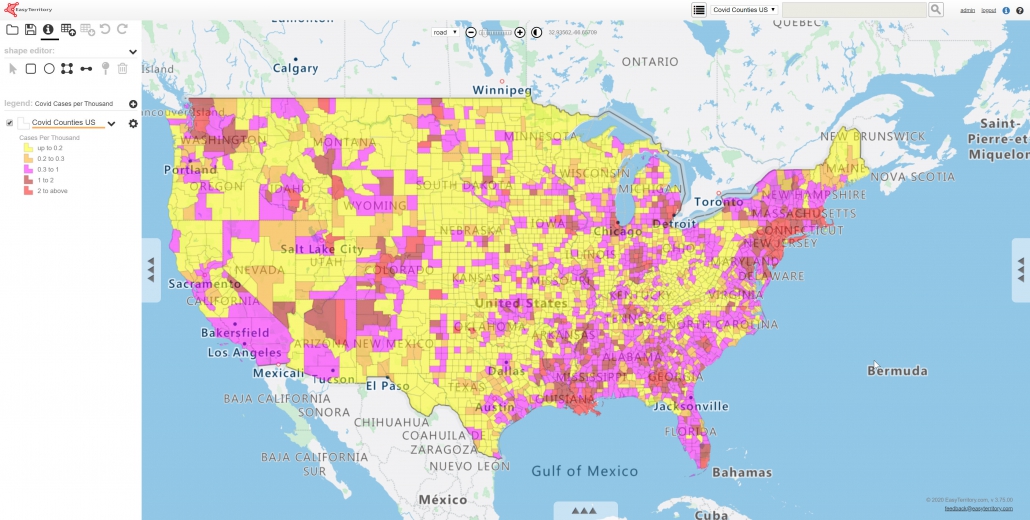
COVID-19 Data Layer
EasyTerritory now has a new COVID-19 data layer for the US based on the Johns Hopkins CSSE dataset located at: https://github.com/CSSEGISandData/COVID-19. We have joined this data with our US county polygon layer and will make it available to customers upon request. Please reach out to sales@easyterritory.com if you would like this data-set added to your instance.
The following data attributes are included in this data-set:
Total Confirmed Cases: (integer) – The total number of confirmed cases in the county as of the last daily update.
Total Confirmed Deaths: (integer) – The total number of confirmed deaths in the county as of the last daily update.
Cases Trending Up?: (boolean) – True if the new daily cases is trending upward (increasing). This is false if the number is flat or decreasing.
Mortality Trending Up?: (boolean) – True if the daily mortality is trending upward (increasing). This is false if the number is flat or decreasing.
Case Trend Days: (float) – The number of days estimated when the total confirmed cases will double from today (0 if the trend is not increasing).
Mortality Trend Days: (float) – The number of days estimated when the total mortality will double from today (0 if the trend is not increasing).
Cases Per Thousand: (float) – The number of confirmed cases for every 1000 people in the county.
Deaths Per Thousand: (float) – The number of confirmed deaths for every 1000 people in the county.
Case Severity: (float) – The product of the case growth rate and case density: cases-per-thousand / case-trend-days.
Mortality Severity: (float) The product of the mortality growth rate and mortality density: deaths-per-thousand / mortality-trend-days
