Overview:
The EasyTerritory Territory Visual can be used with or without an EasyTerritory subscription. If you already have a subscription, awesome, please continue with this documentation. If you are interested in creating sales or service territories to display and analayze in Power BI, please request a free trial. If you do not yet have an EasyTerritory subscription but would like to load your own territory polygons (via GeoJSON) and point records, please visit here.
This documentation is divided into three sections. First, directions to load territory data as polygons. Second, directions to load record data as points. Lastly, steps on how to leverage the many features this visual has to offer.
Download the latest version of our Power BI Visual from App Source.
Load territory data:
Step 1: Create territories in EasyTerritory Standard or Enterprise Edition and Export territory data.
- If you need access to EasyTerritory Standard or Enterprise Edition, please register here.
- Open or create an EasyTerritory project and build your territories. Then, click the shape stats icon in the ‘markup’ panel.
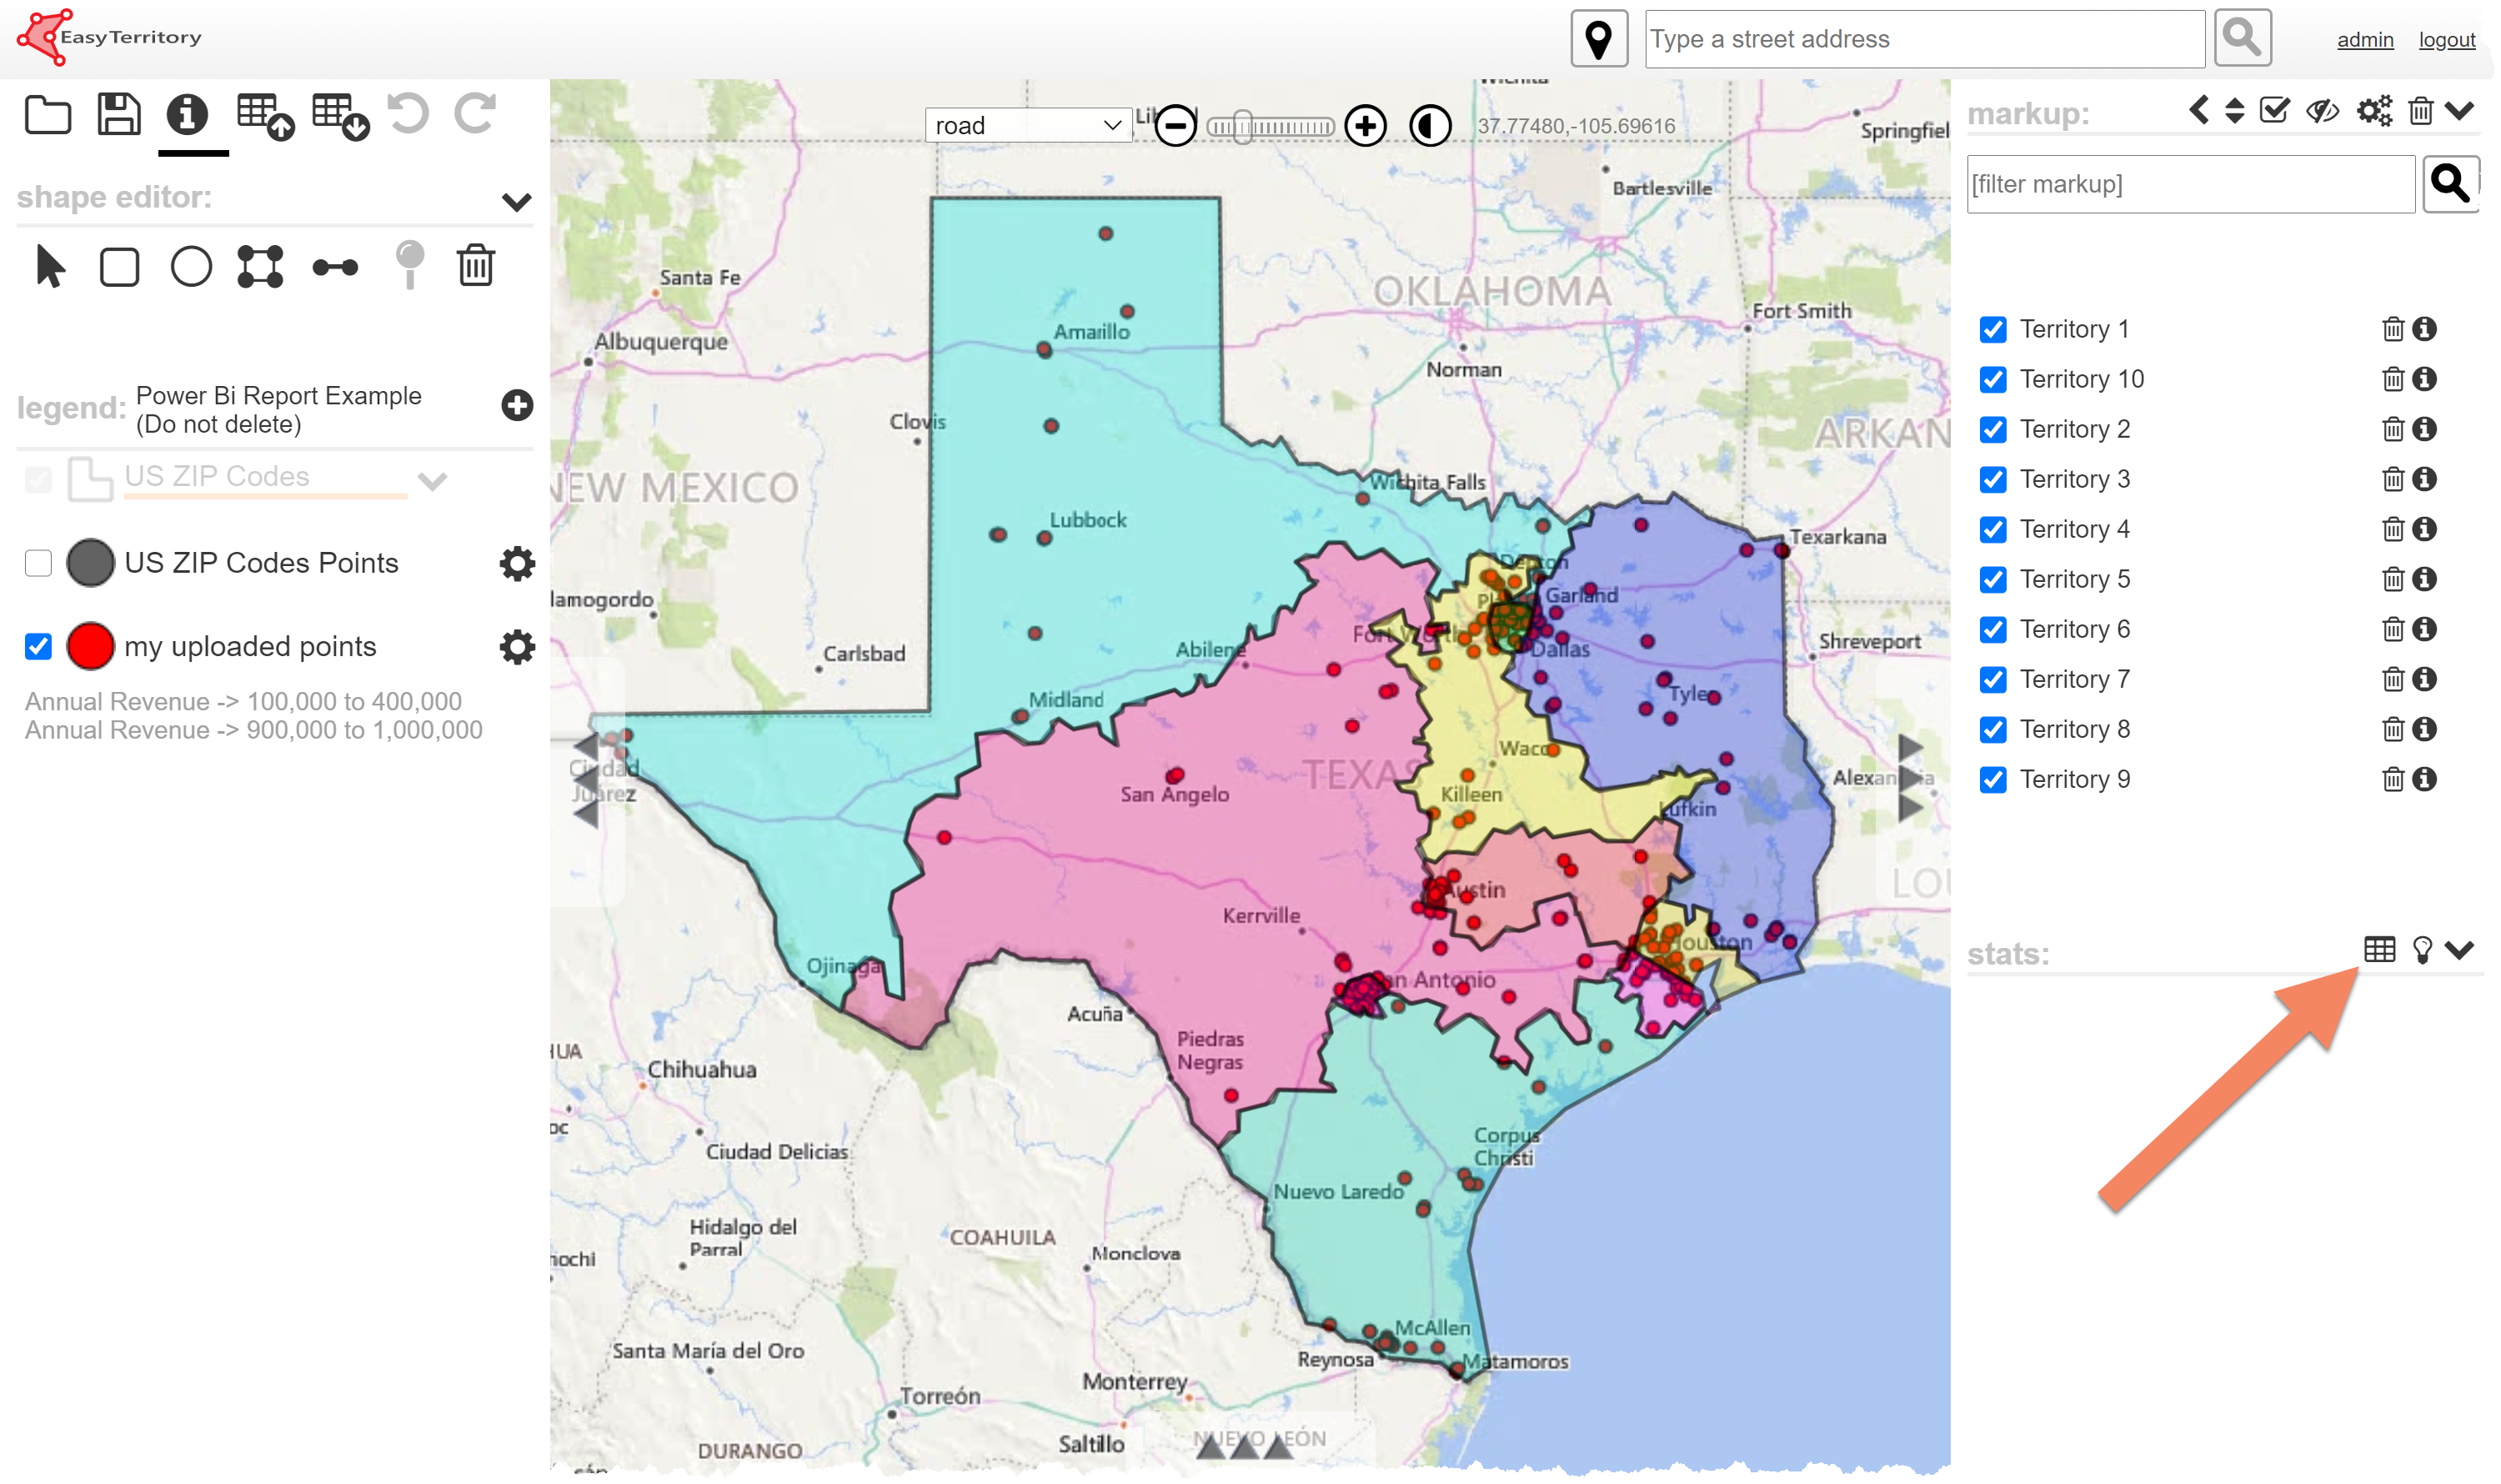
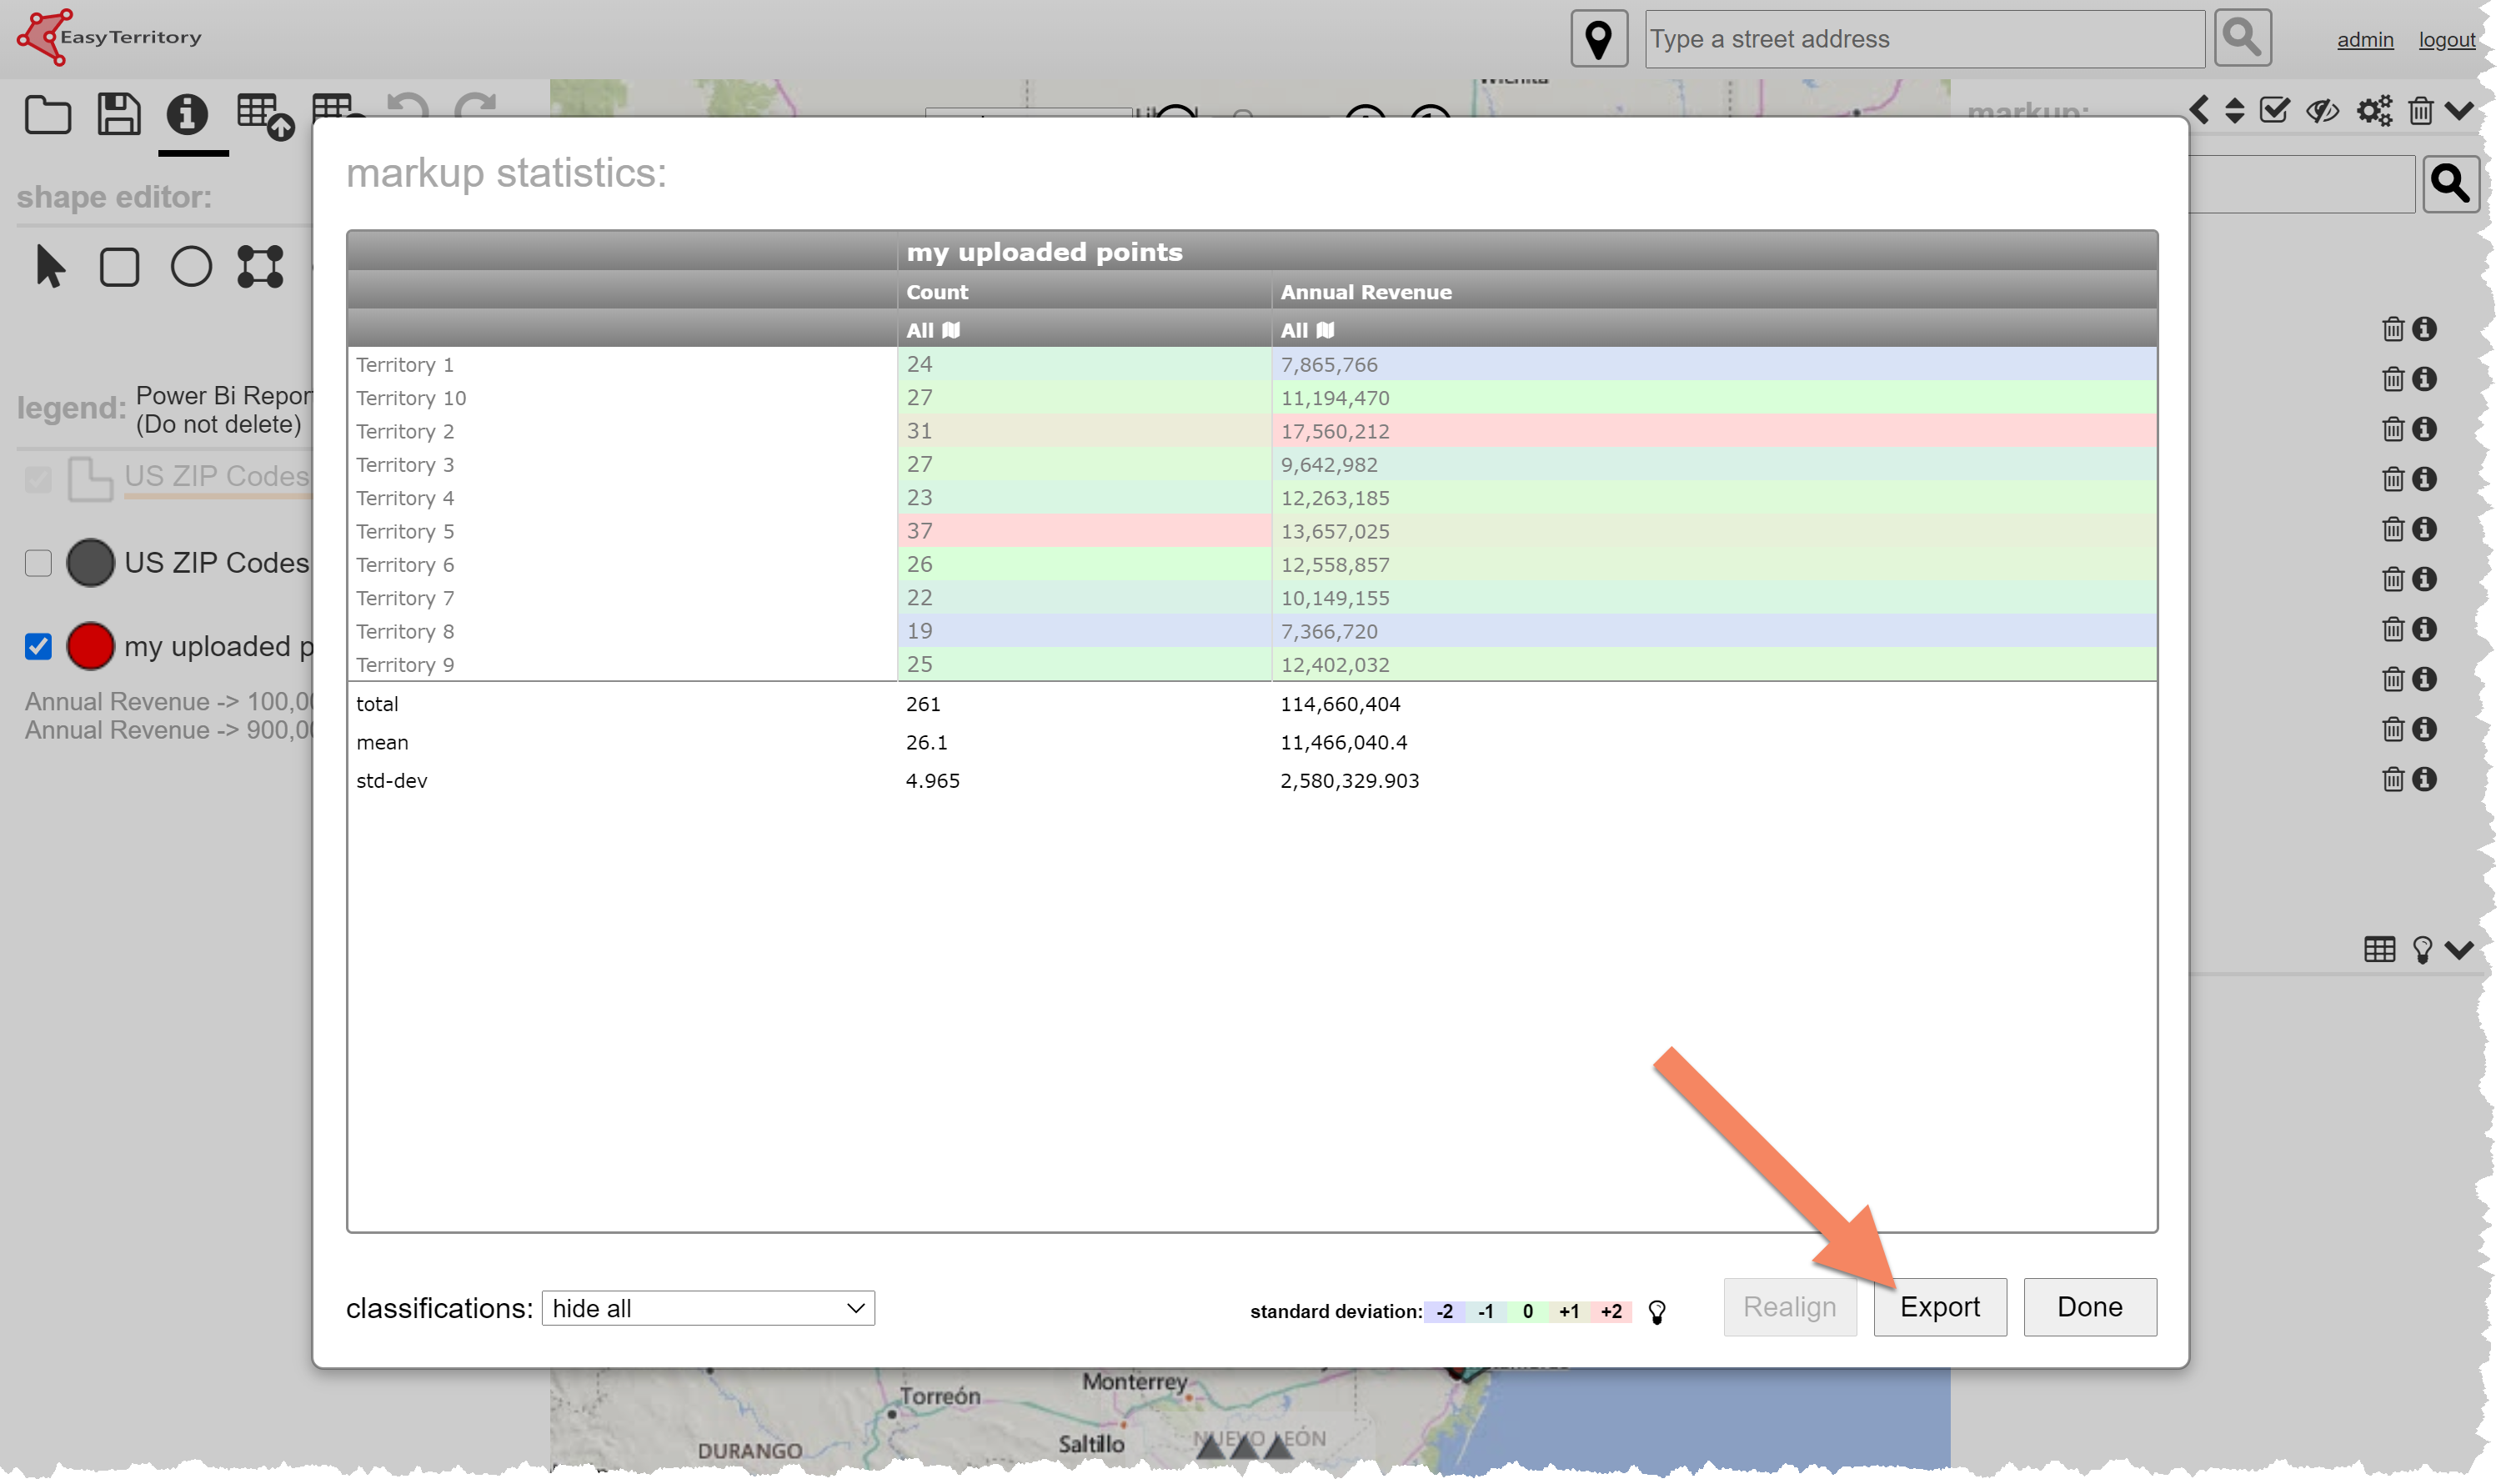
- Next, click ‘Export’ in the shape stats dialogue.
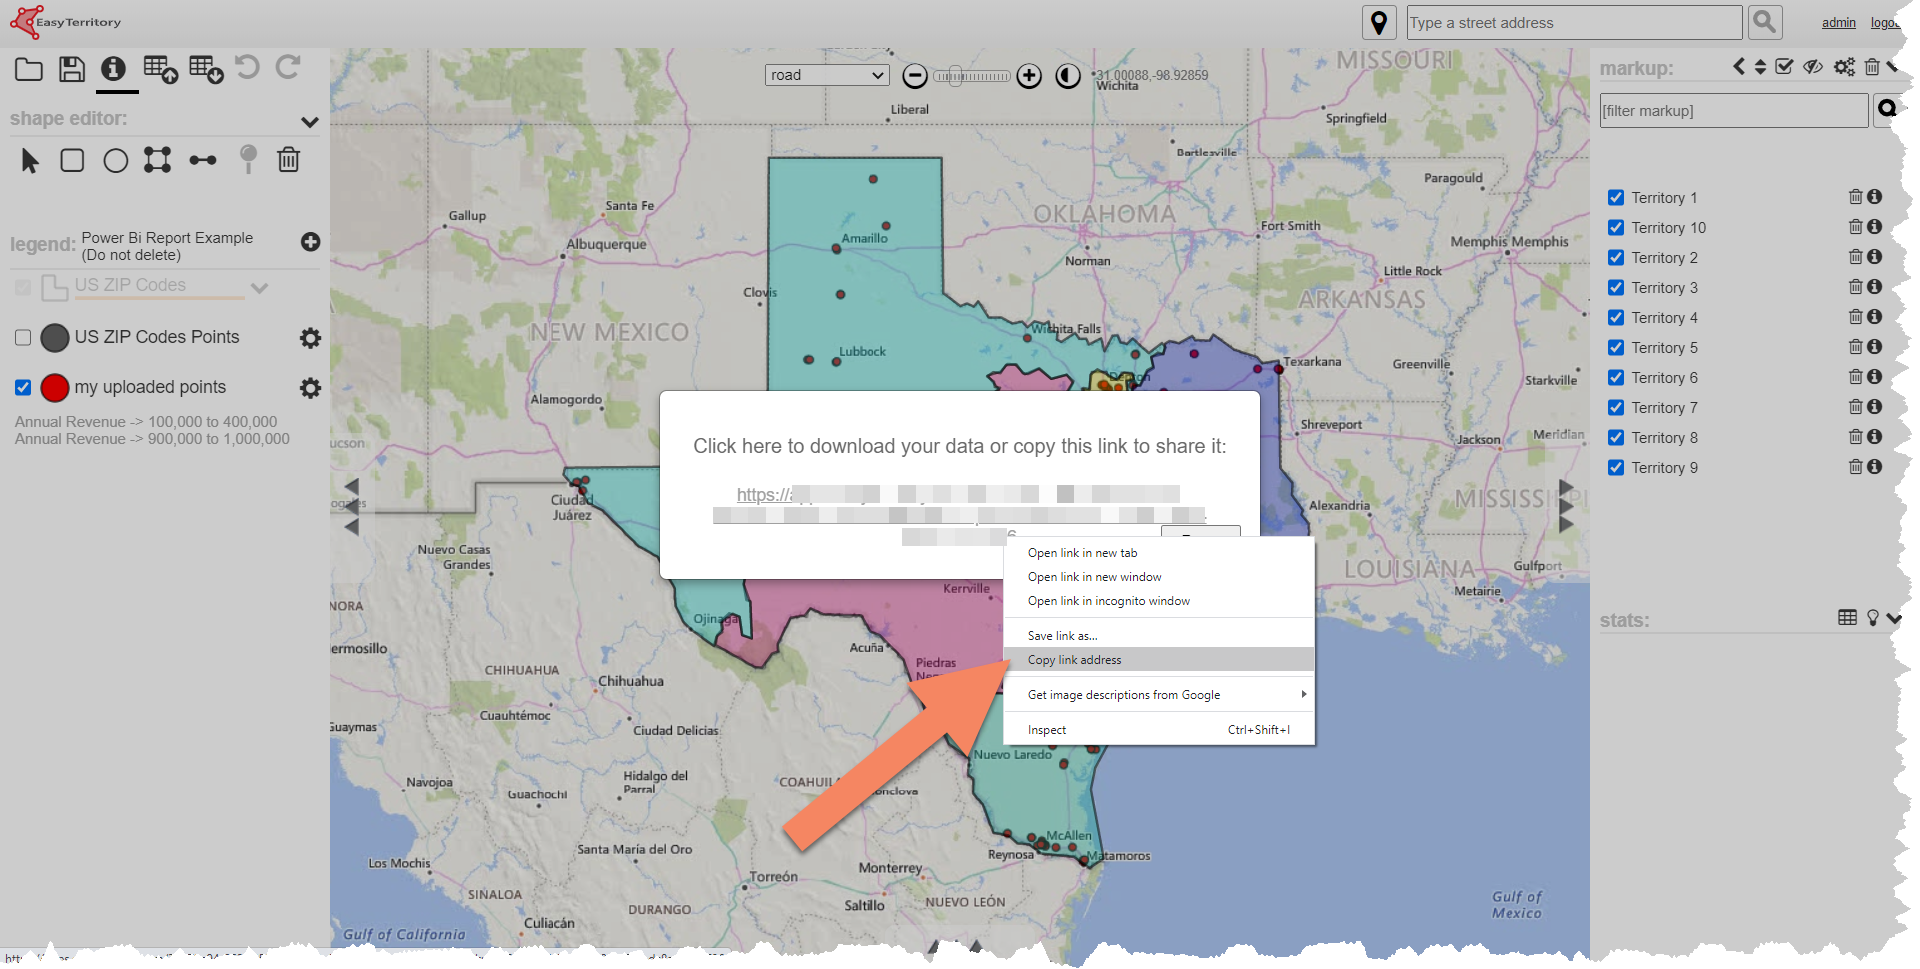
Step 2: Download GeoJSON URL.
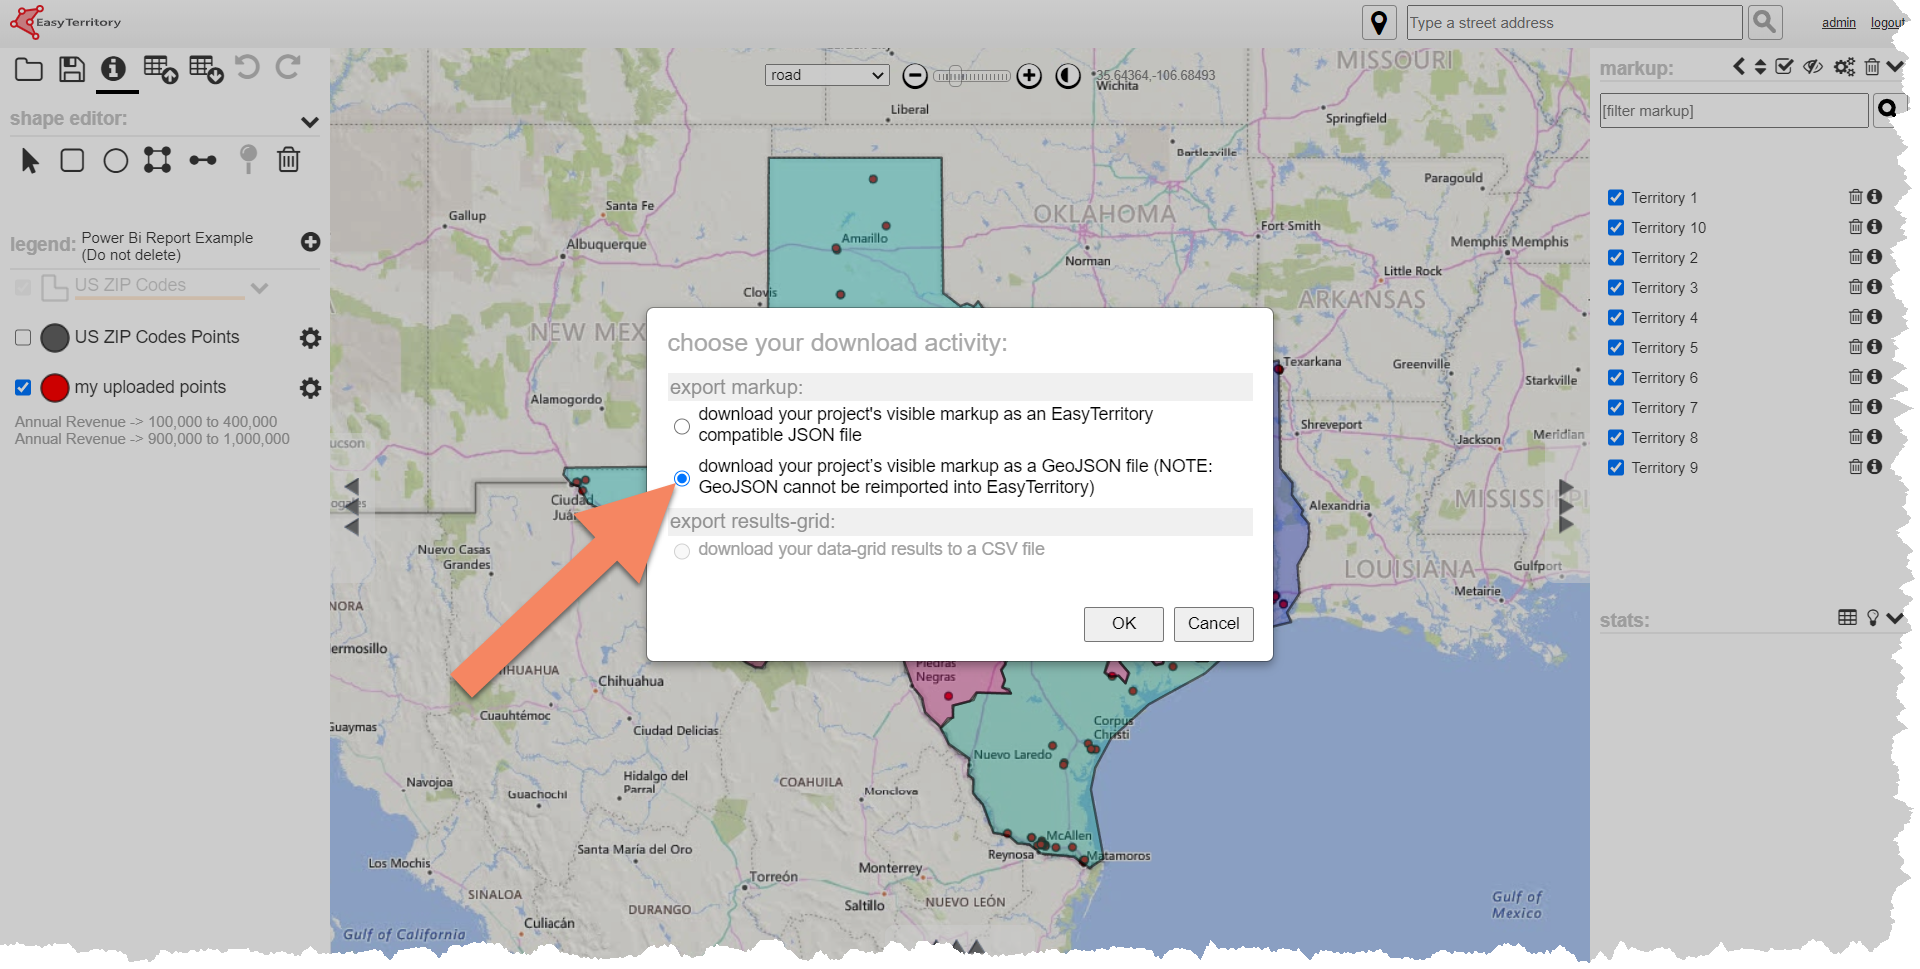
- When the ‘choose your download activity’ dialogue opens, click ‘download your project’s visible markup to a GeoJSON File’.
- Copy the GeoJSON URL to your clipboard (right click on the URL link).
Step 3: Load shape stats in your Power BI report and add EasyTerritory Power BI visual
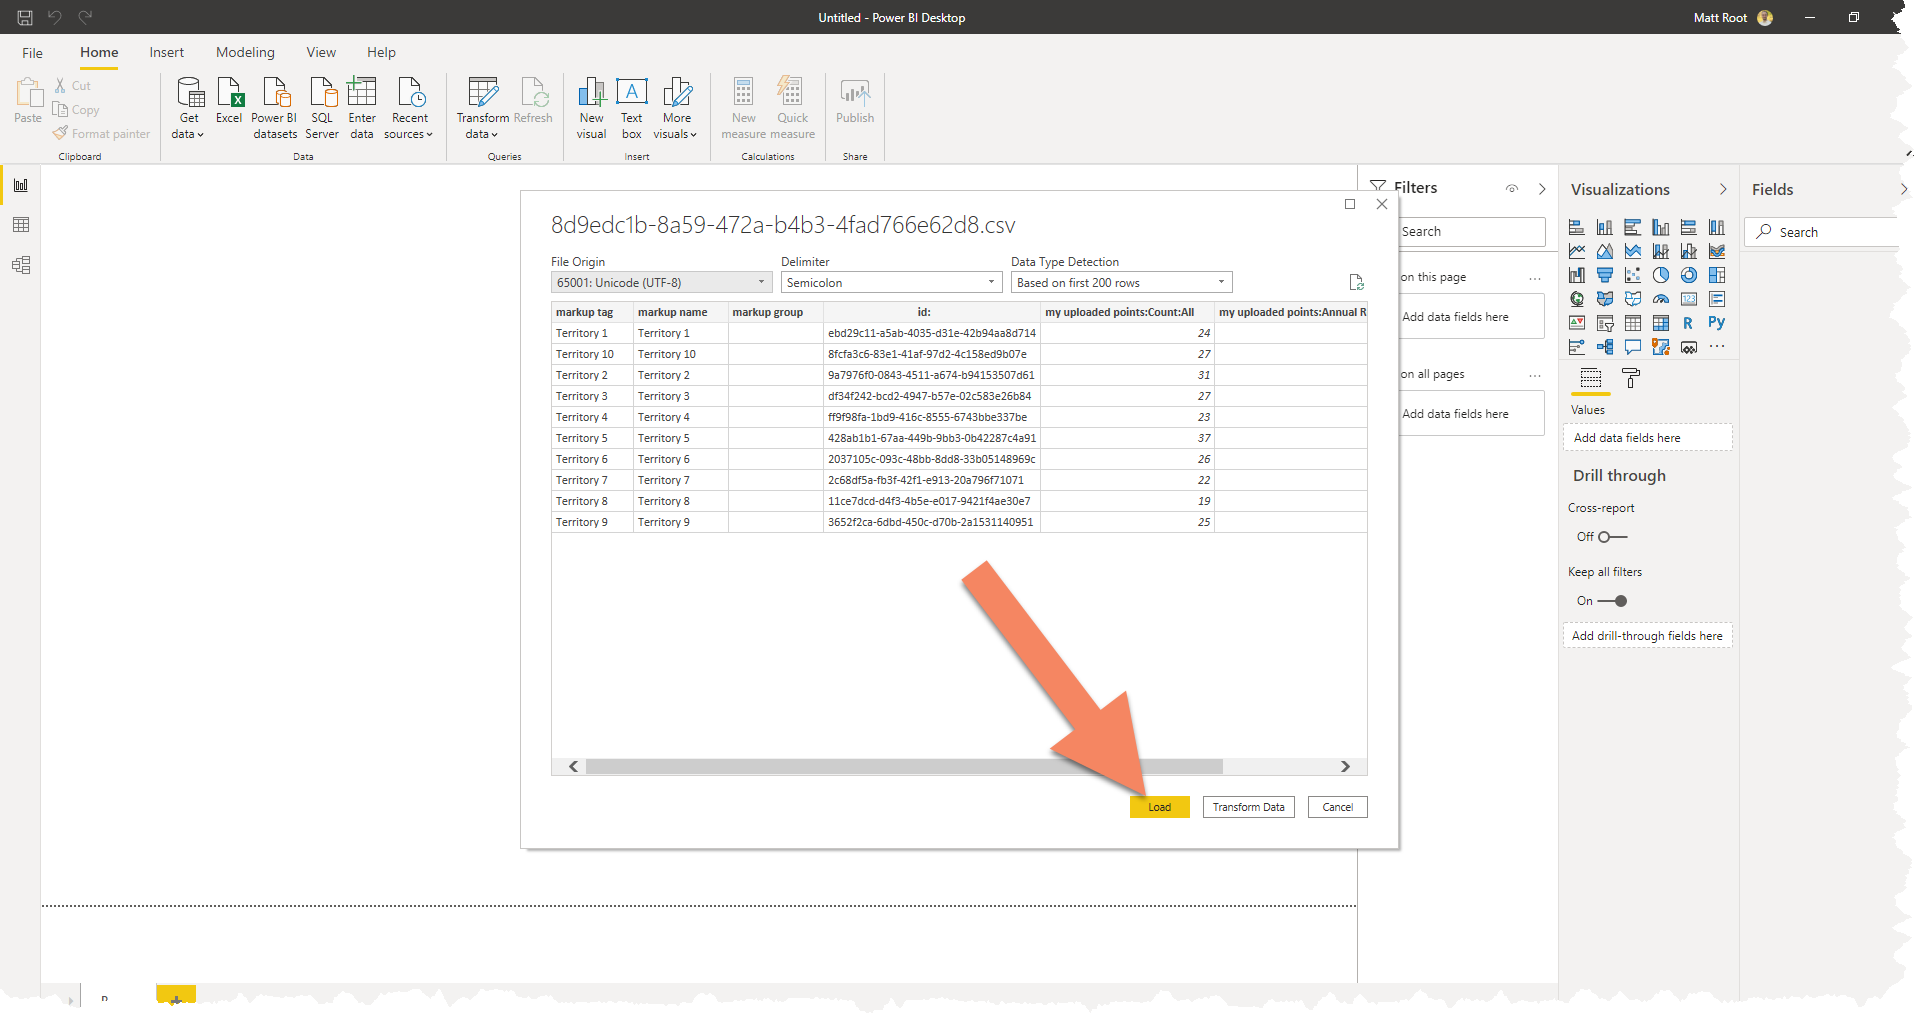
- Load your ‘shape stats’ export file from EasyTerritory into Power BI Desktop.
- Download Power BI desktop here.
- To load the EasyTerritory Territory Visual browse to App Source or, add the visual within Power BI Desktop.
- Within Power BI Desktop, under the ‘Visualizations’ section:
- 1. click the three dot ellipsis and select ‘Get More Visuals’ 2. Search for ‘EasyTerritory’ 3. select ‘Add’
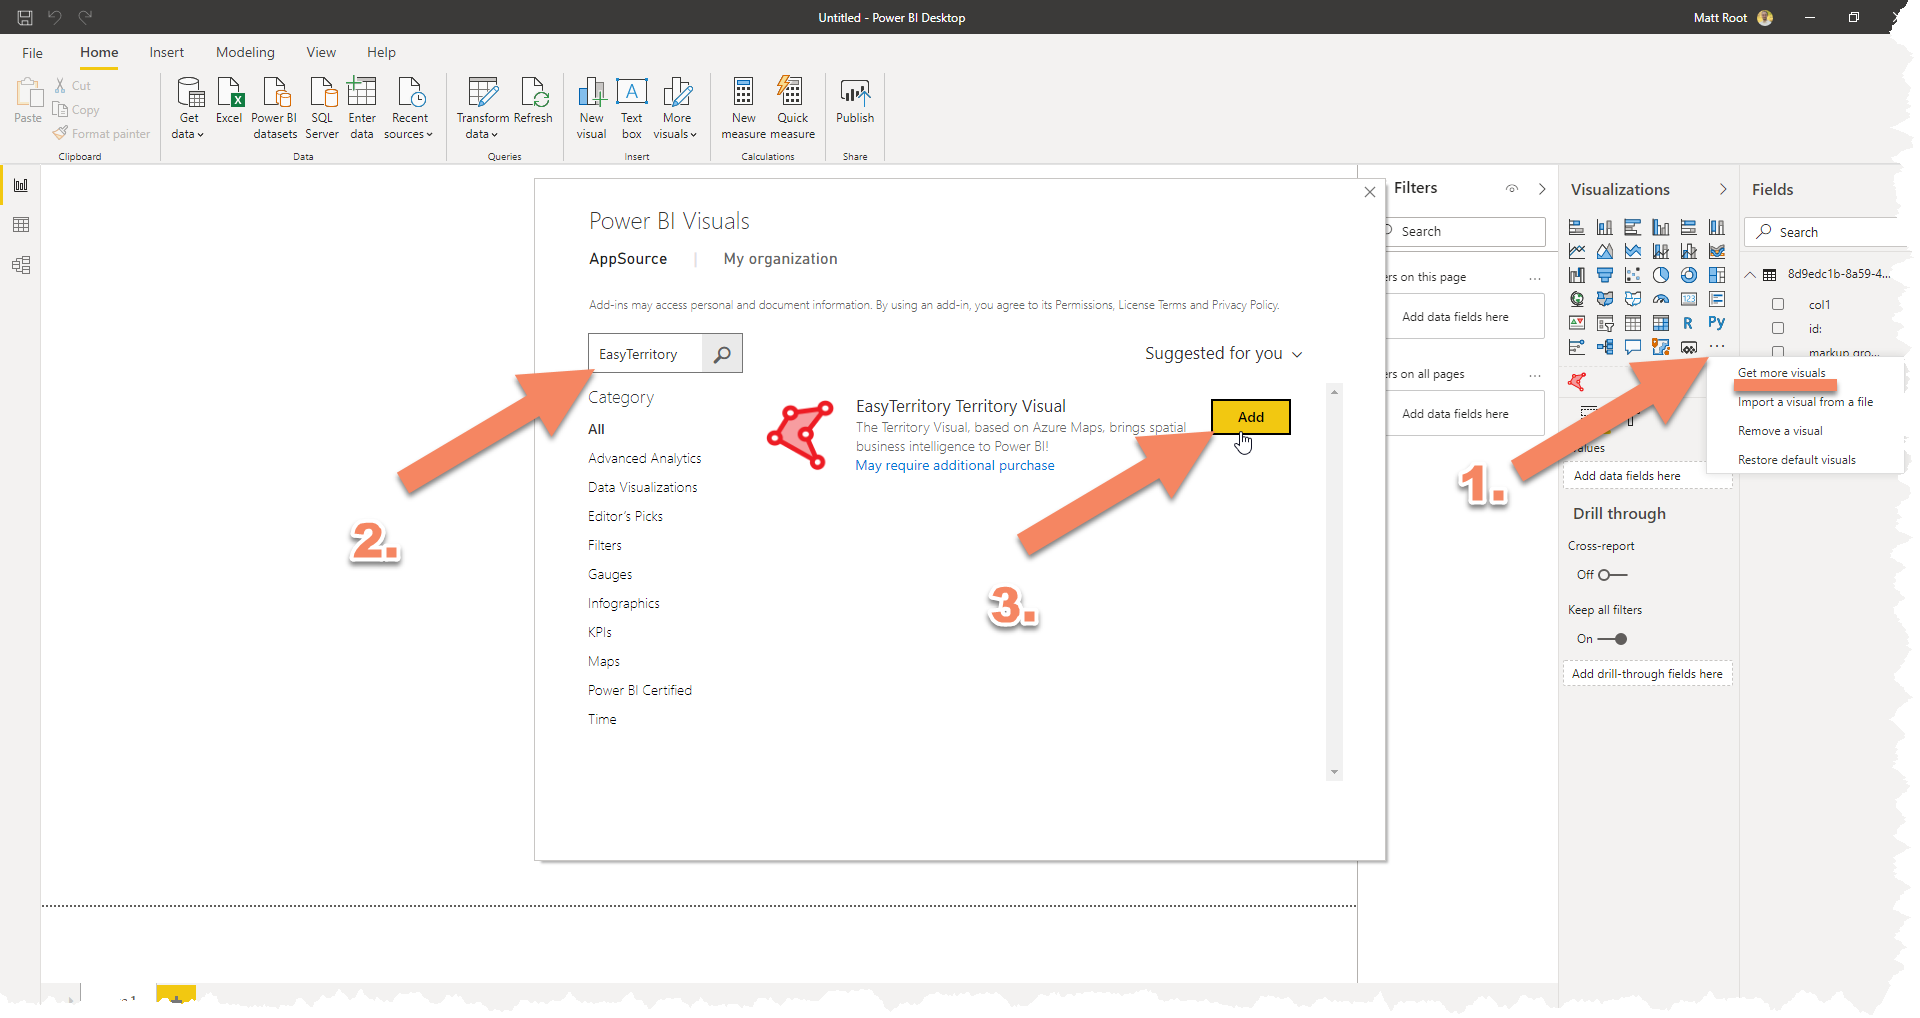
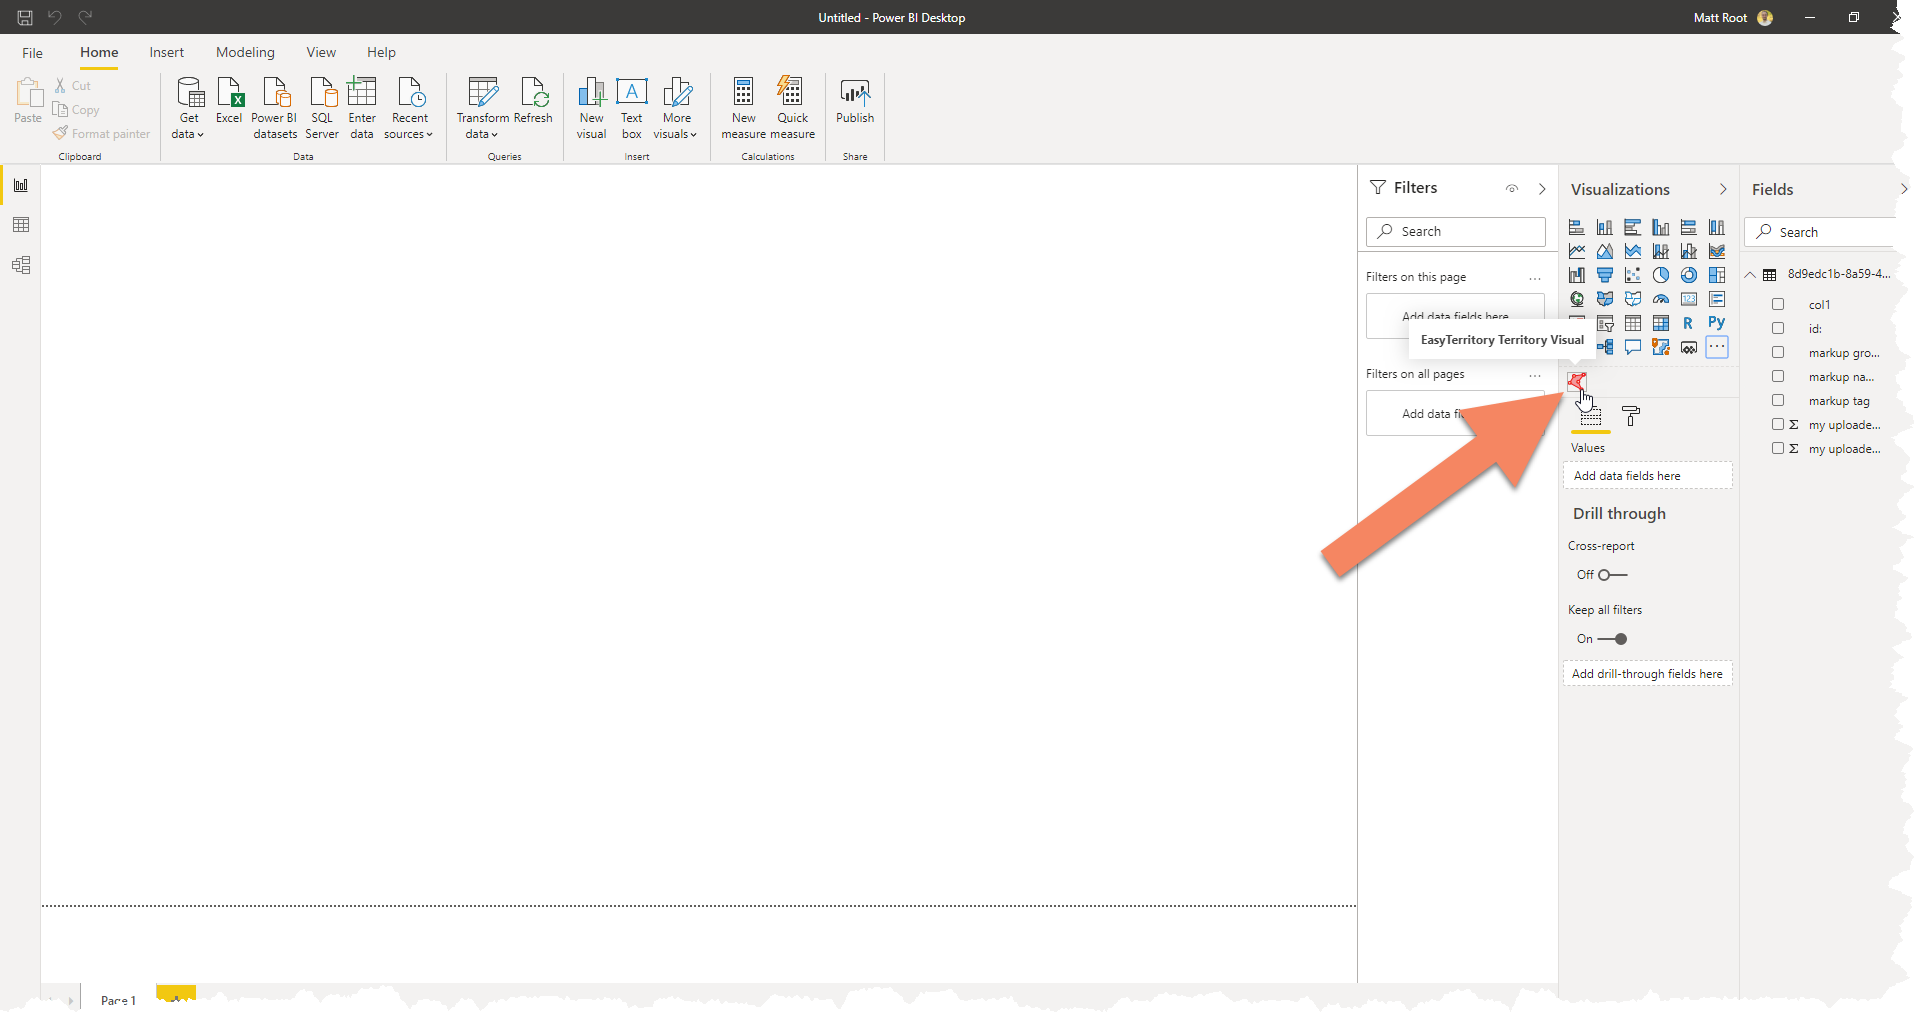
- Next, select the EasyTerritory Territory Visual
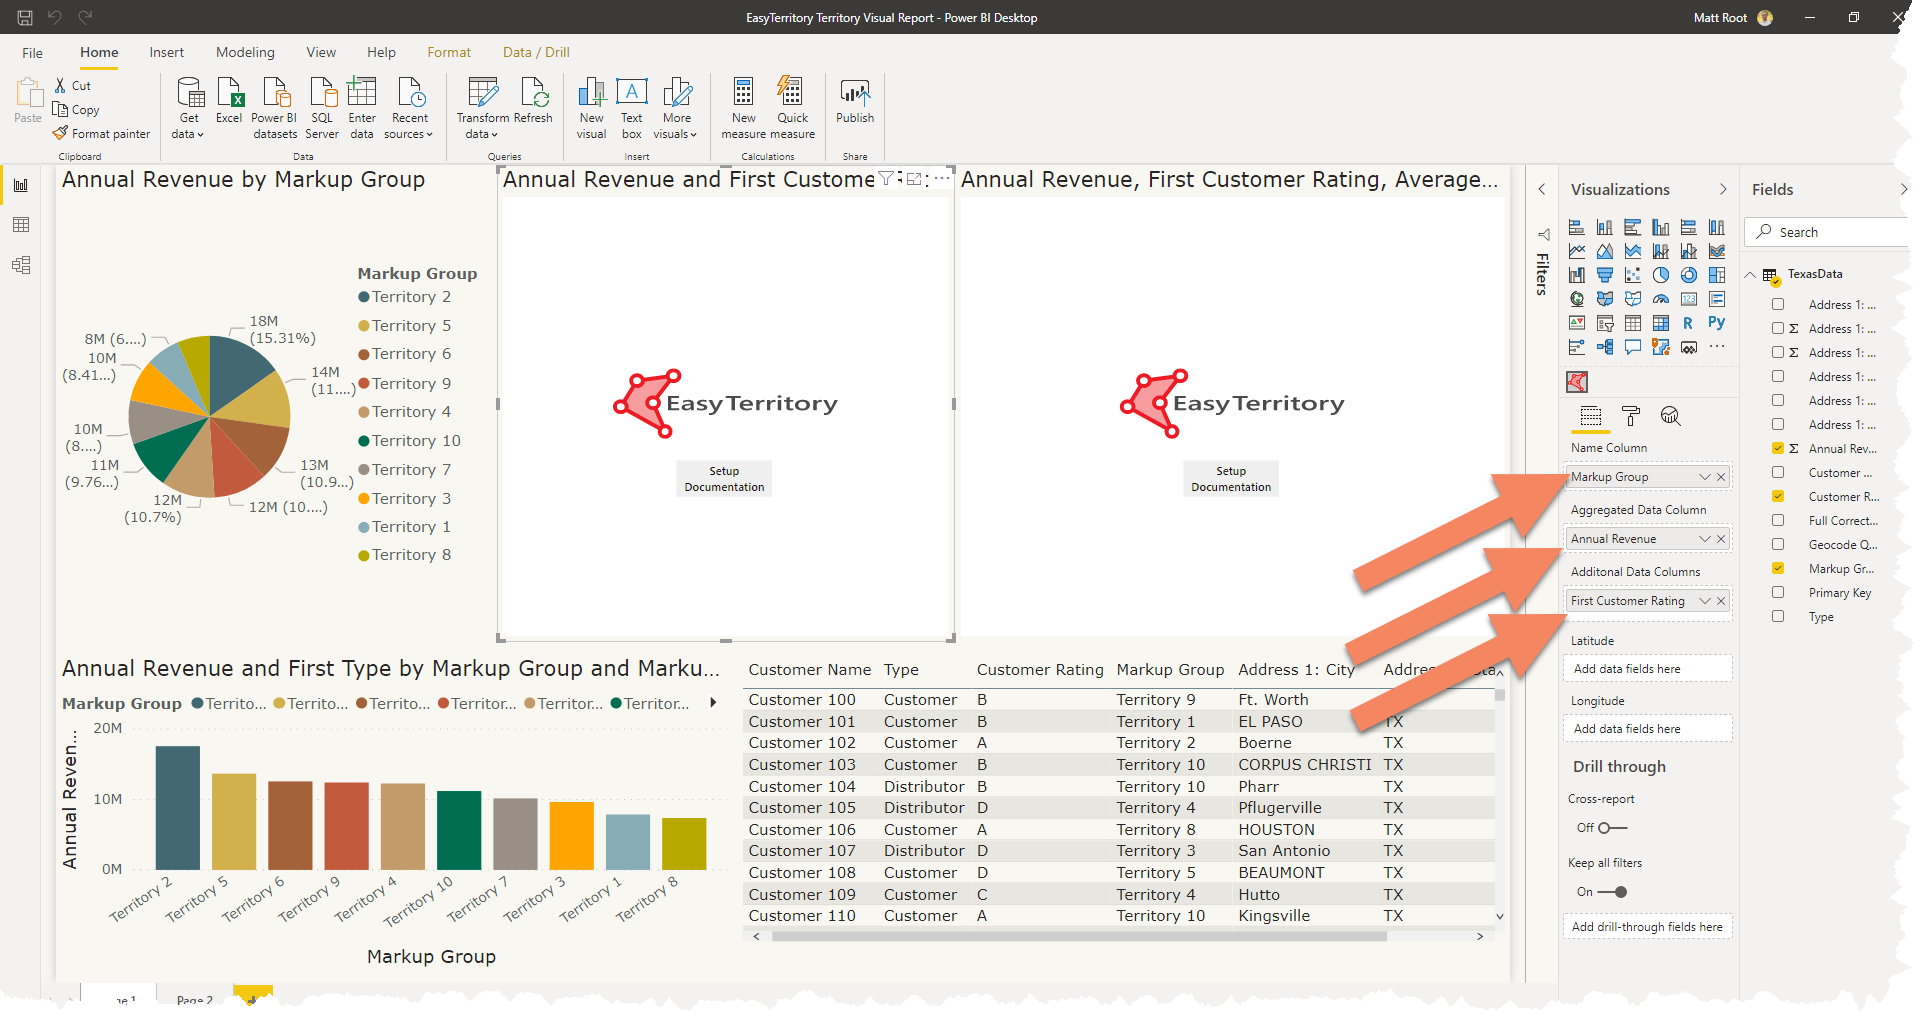
Step 4: Add data source columns from Power BI to the EasyTerritory Visual.
- Required: Add the territory name column from your ‘shape stats’ data source to the ‘Name Column’ category field.
- Required: Add any metric column from your ‘shape stats’ data source into the ‘Aggregated Data Column’ value field.
- To sync your territory colors with other Power BI Visuals, make sure the column you add to the ‘Aggregated column’ is the same as the column added to the ‘values’ field in other Power BI visuals in your report. For more info on this go to the Interactions and Highlighting section.
- Optional: Add any column you would like from your ‘shape stats’ to the ‘Additional Data Columns’ to hold data to display in the tool tips.
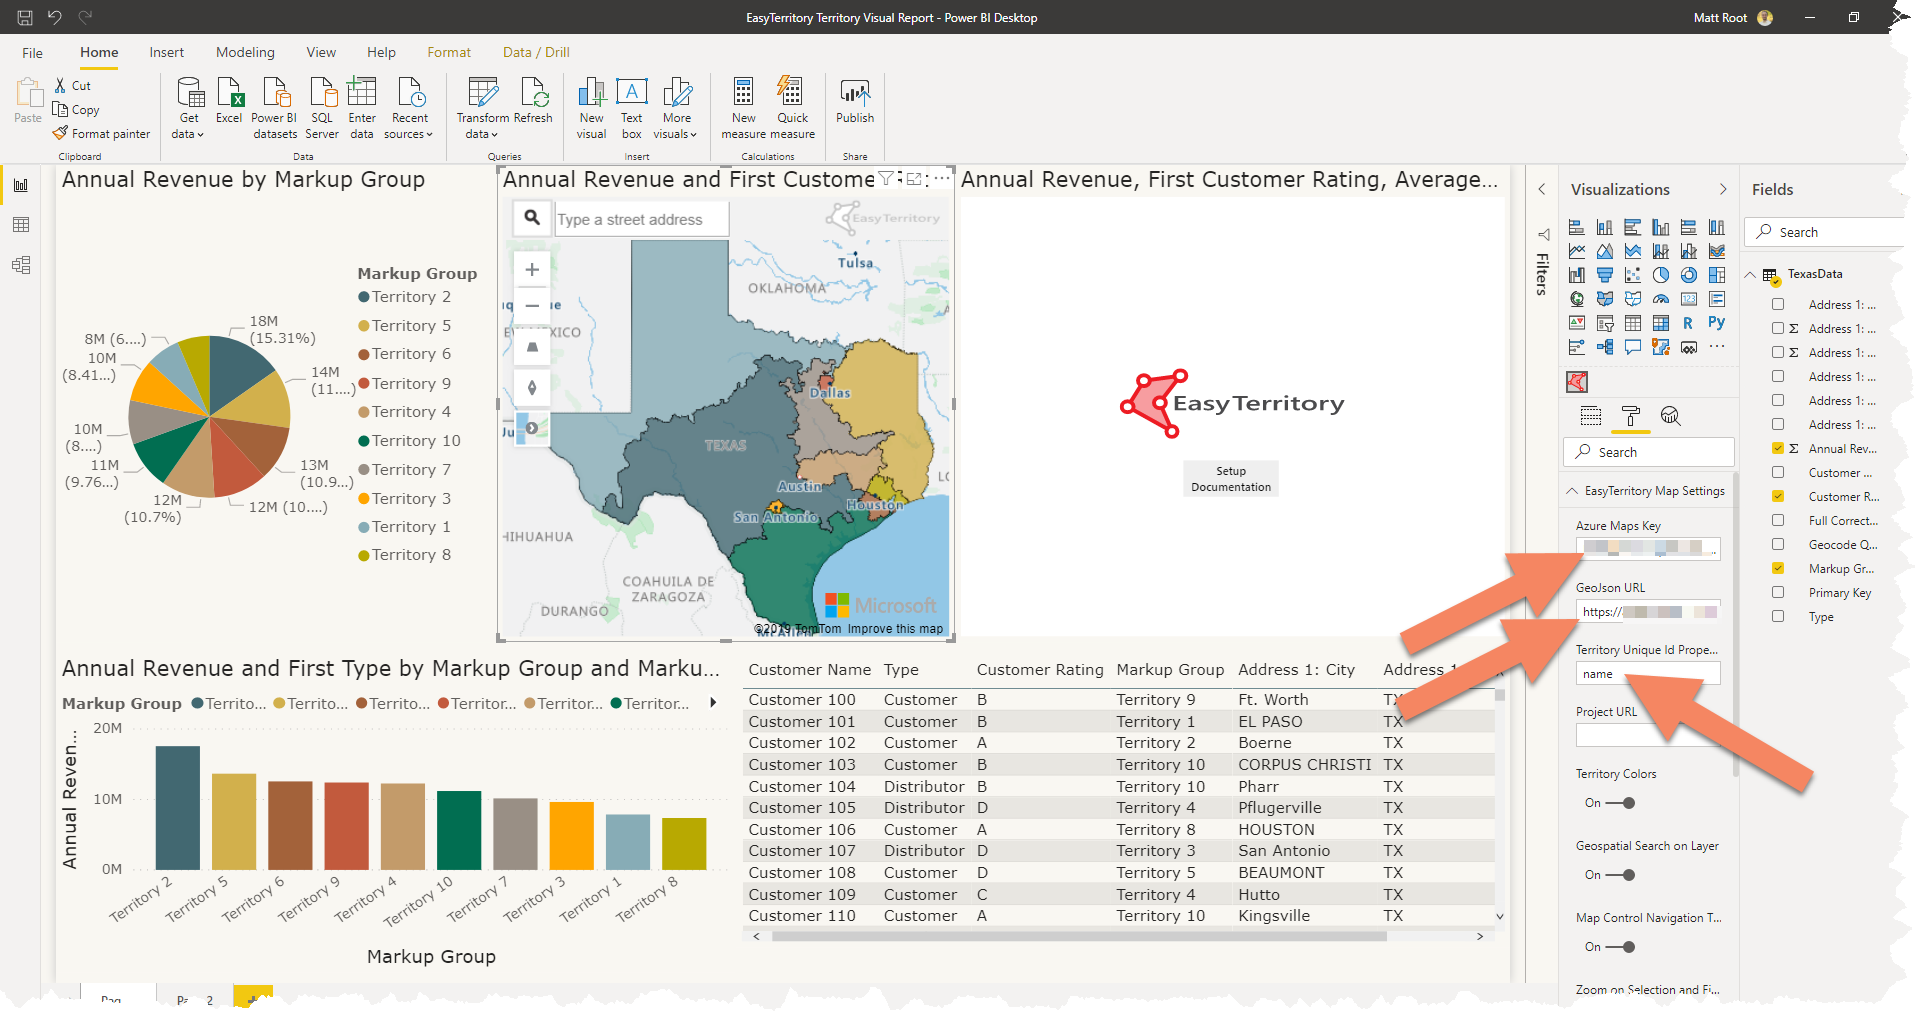
Step 5: Enter Azure Maps Key and GeoJson Url
- If you do not have an Azure Maps key, no problem. Directions on how to get a free Azure Maps Key here.
- Required: Enter your Azure Maps Key in the ‘EasyTerritory Map Settings’ section of the format panel in Power BI.
- Required: Enter the URL of the GeoJSON (from step 2, bullet point three) in ‘EasyTerritory Map Settings’ Section of the format Panel in Power BI.
- Required: Enter the property from your GeoJSON that holds the value of the ‘Name Column’ from the ‘Fields Panel’ (from step, bullet point one).
- Optional: Enter the EasyTerritory project Id URL into the ‘EasyTerritory Project URL’ input field if you would like a direct link to your EasyTerritory project from Power BI.
- Please contact an EasyTerritory admin to ensure your EasyTerritory application permits connections to your Power BI instance.
Load Records as Points
Step 1: Geocode records in EasyTerritory
- Open or create an EasyTerritory project and use the upload button and select ‘import address records from EXCEL or CSV’. You will then see your records are geocoded and pinned on the EasyTerritory map.
Step 2: Add EasyTerritory Power BI visual and load business data in your Power BI report
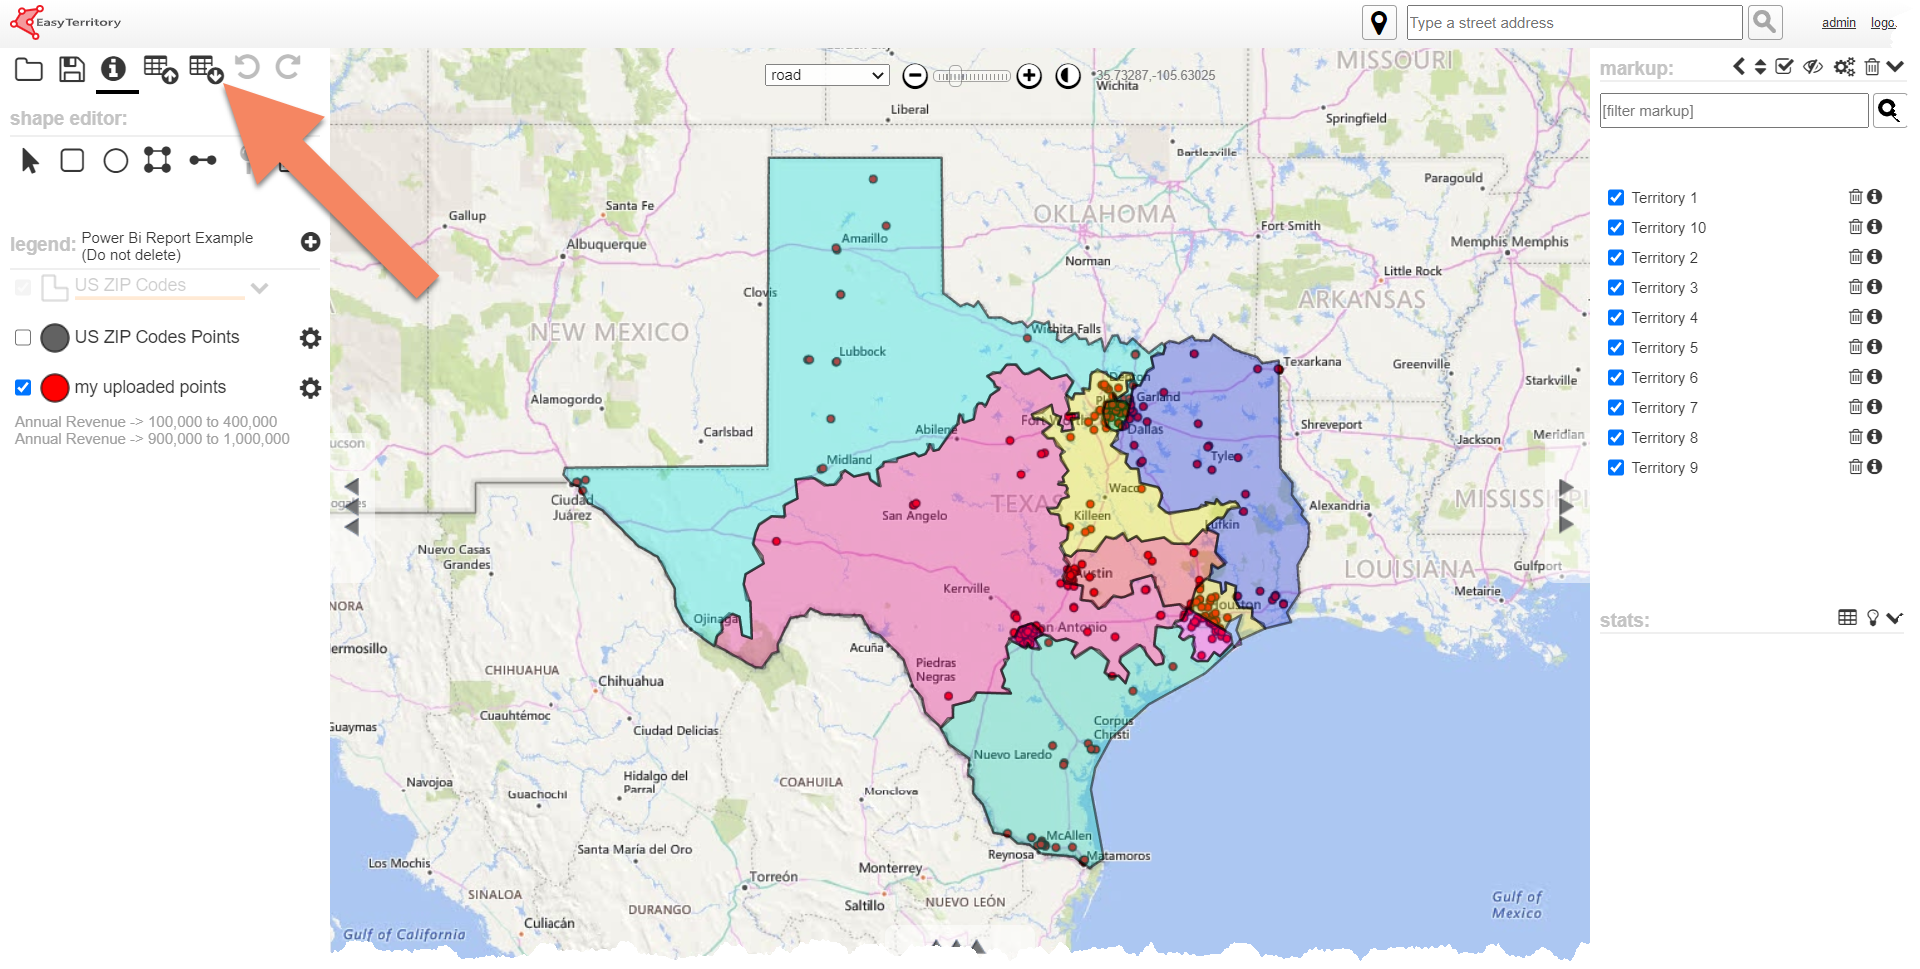
- In EasyTerritory use a drawing tool to select the region of points you would like to import into Power BI. After those points are loaded into the EasyTerritory data grid, select the download button and select ‘download your data gird results to a csv’.
- Once the CSV document is download locally on your machine upload that data source into Power BI.
Step 3: Configure fields in EasyTerritory Power BI Visual
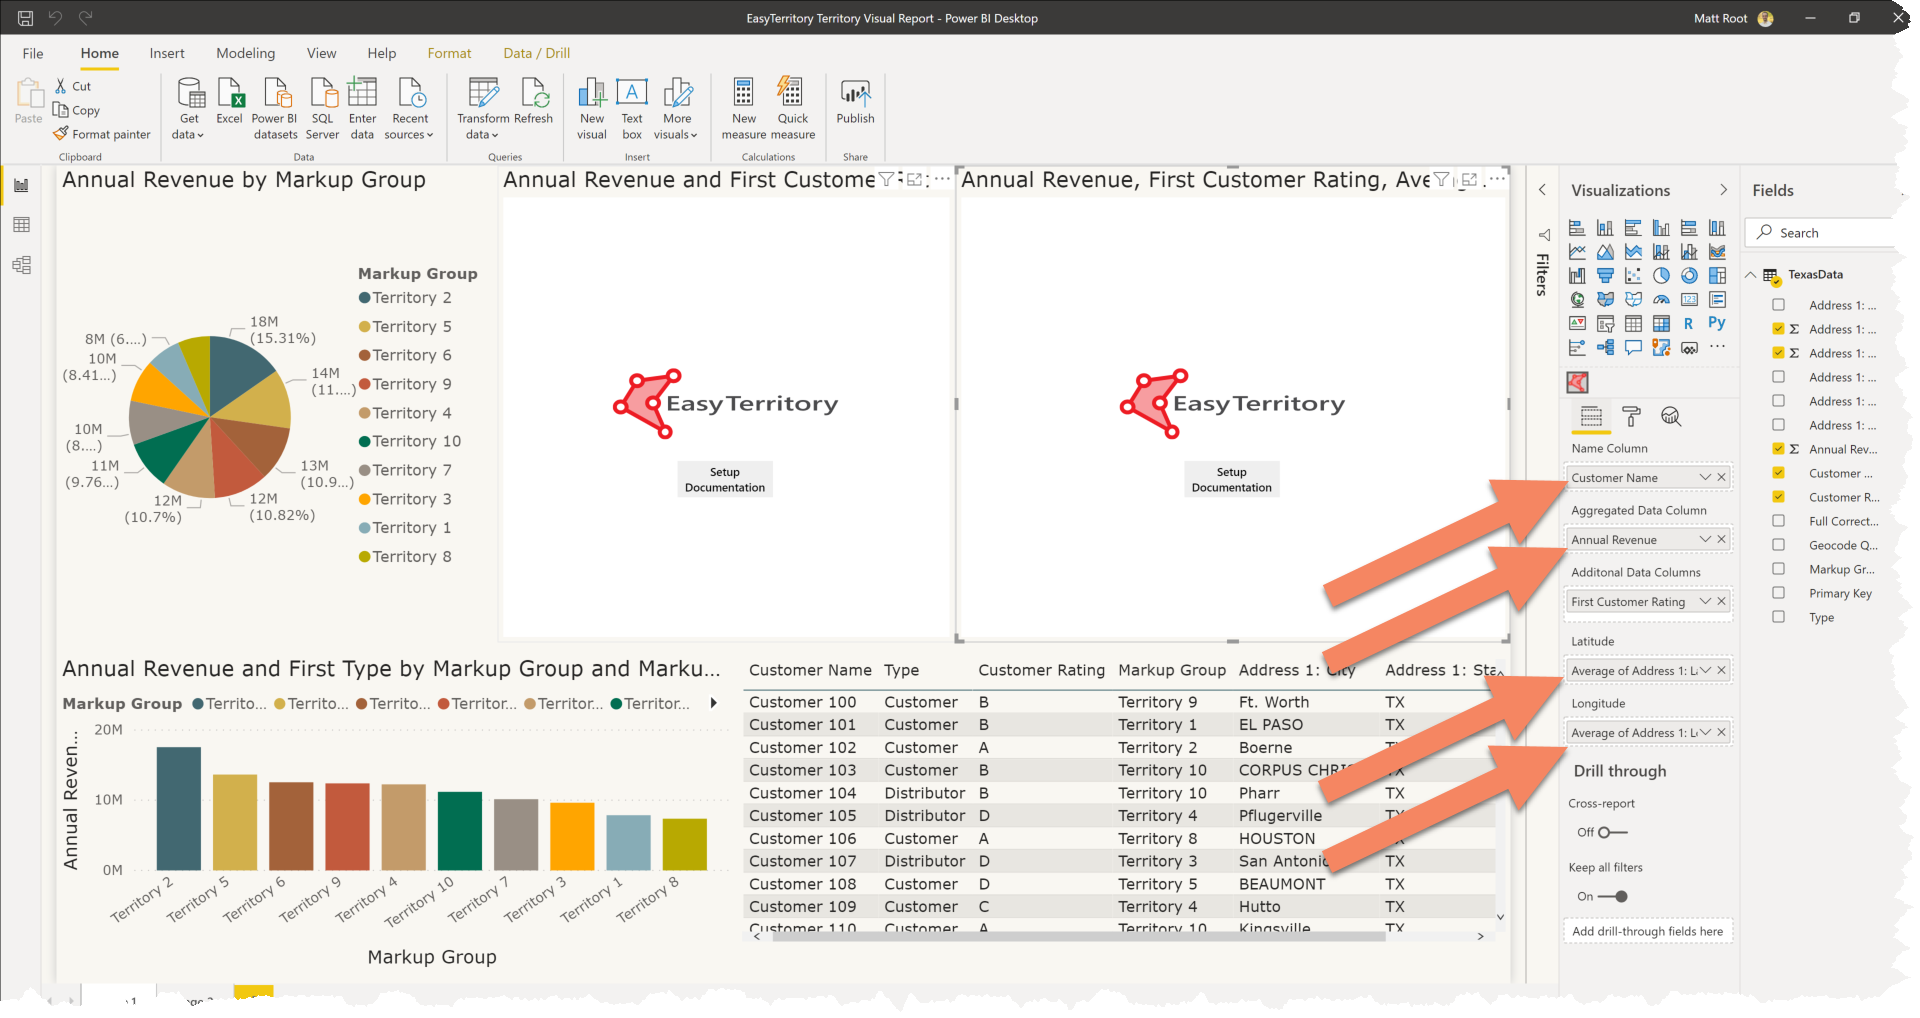
- Required: Add the record ‘name’ column of your data source into the ‘Name Column’ category field.
- Required: Add any metric column from your data source into the the ‘Aggregated Value’ value field.
- Required: It is required that you add the latitude and longitude columns from the EasyTerritory geocode operation (step 1, bullet point one).
- Optional: Add any column you would like to the ‘Additional Data Columns’ to hold data to display in the tool tips.
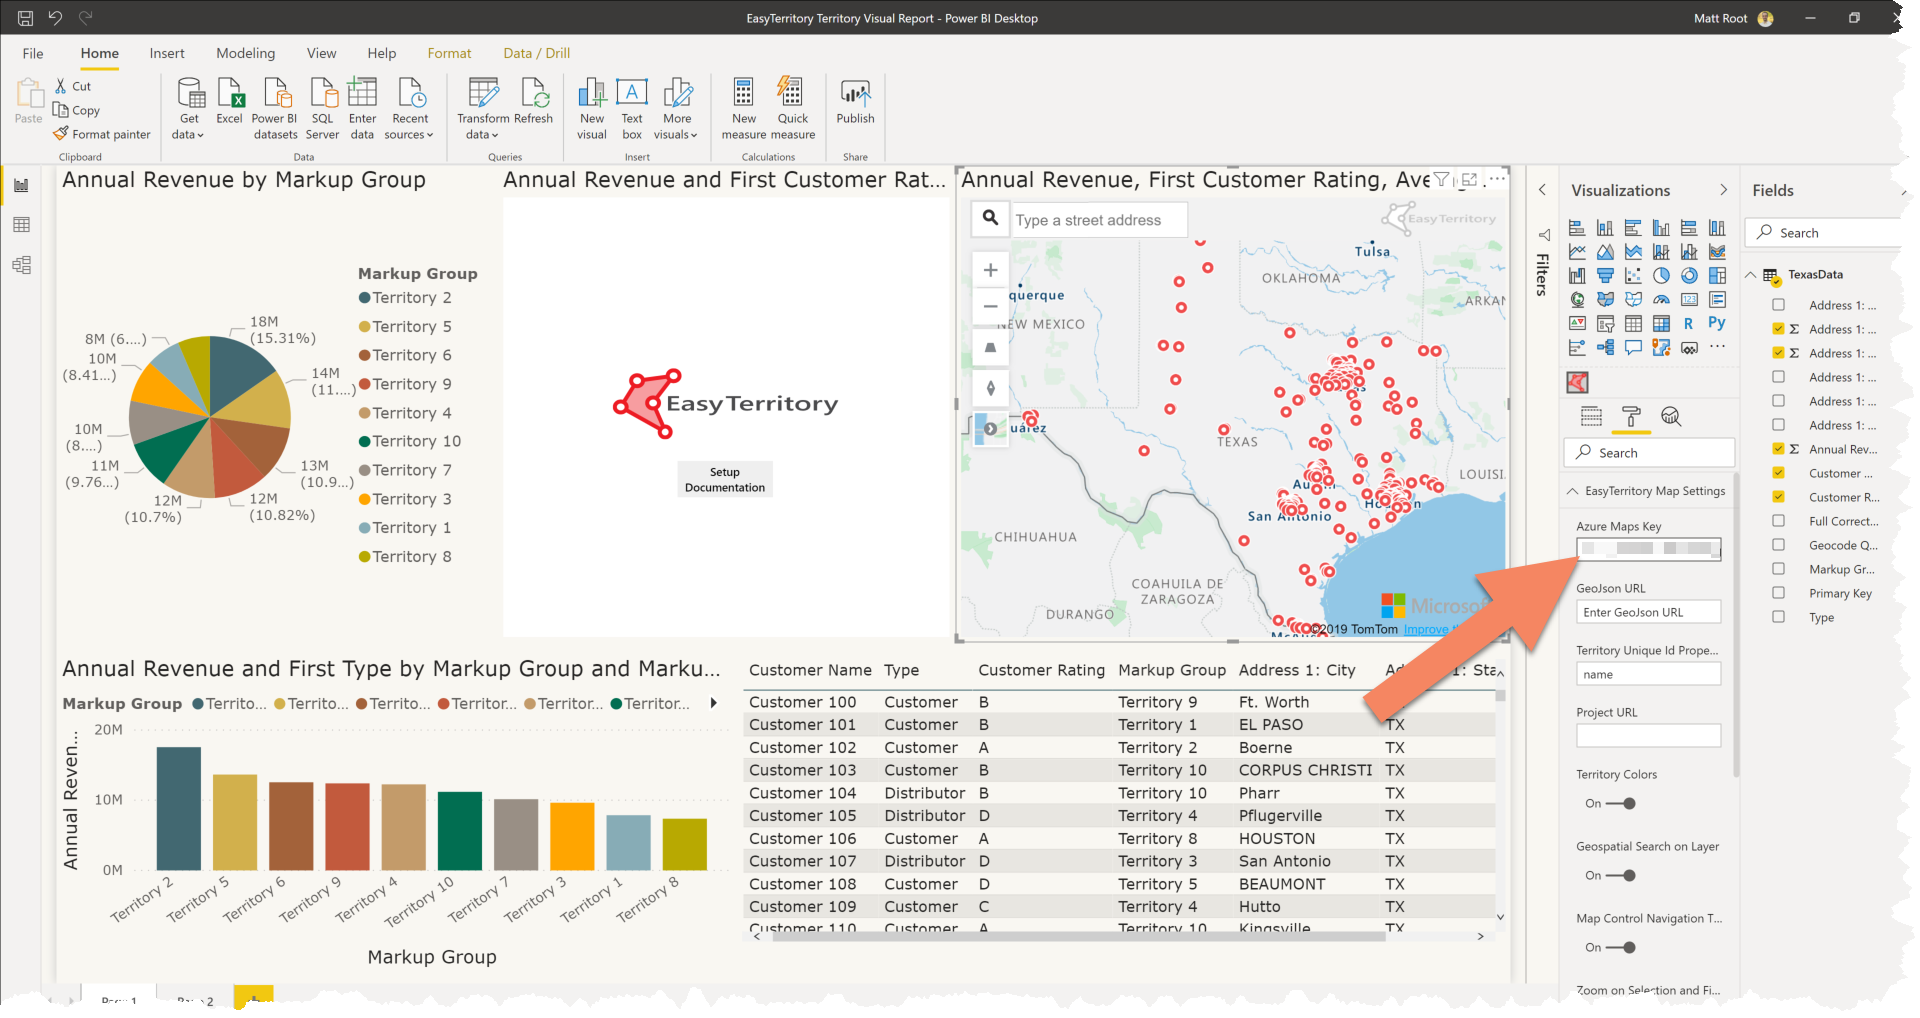
Step 4: Configure Format Panel in EasyTerritory Power BI Visual
- If you do not have an Azure Maps key, no problem. Directions on how to get a free Azure Maps Key.
- Required: Enter your Azure Maps Key in the ‘EasyTerritory Map Settings’ section of the format panel in Power BI.
EasyTerritory Visual Features
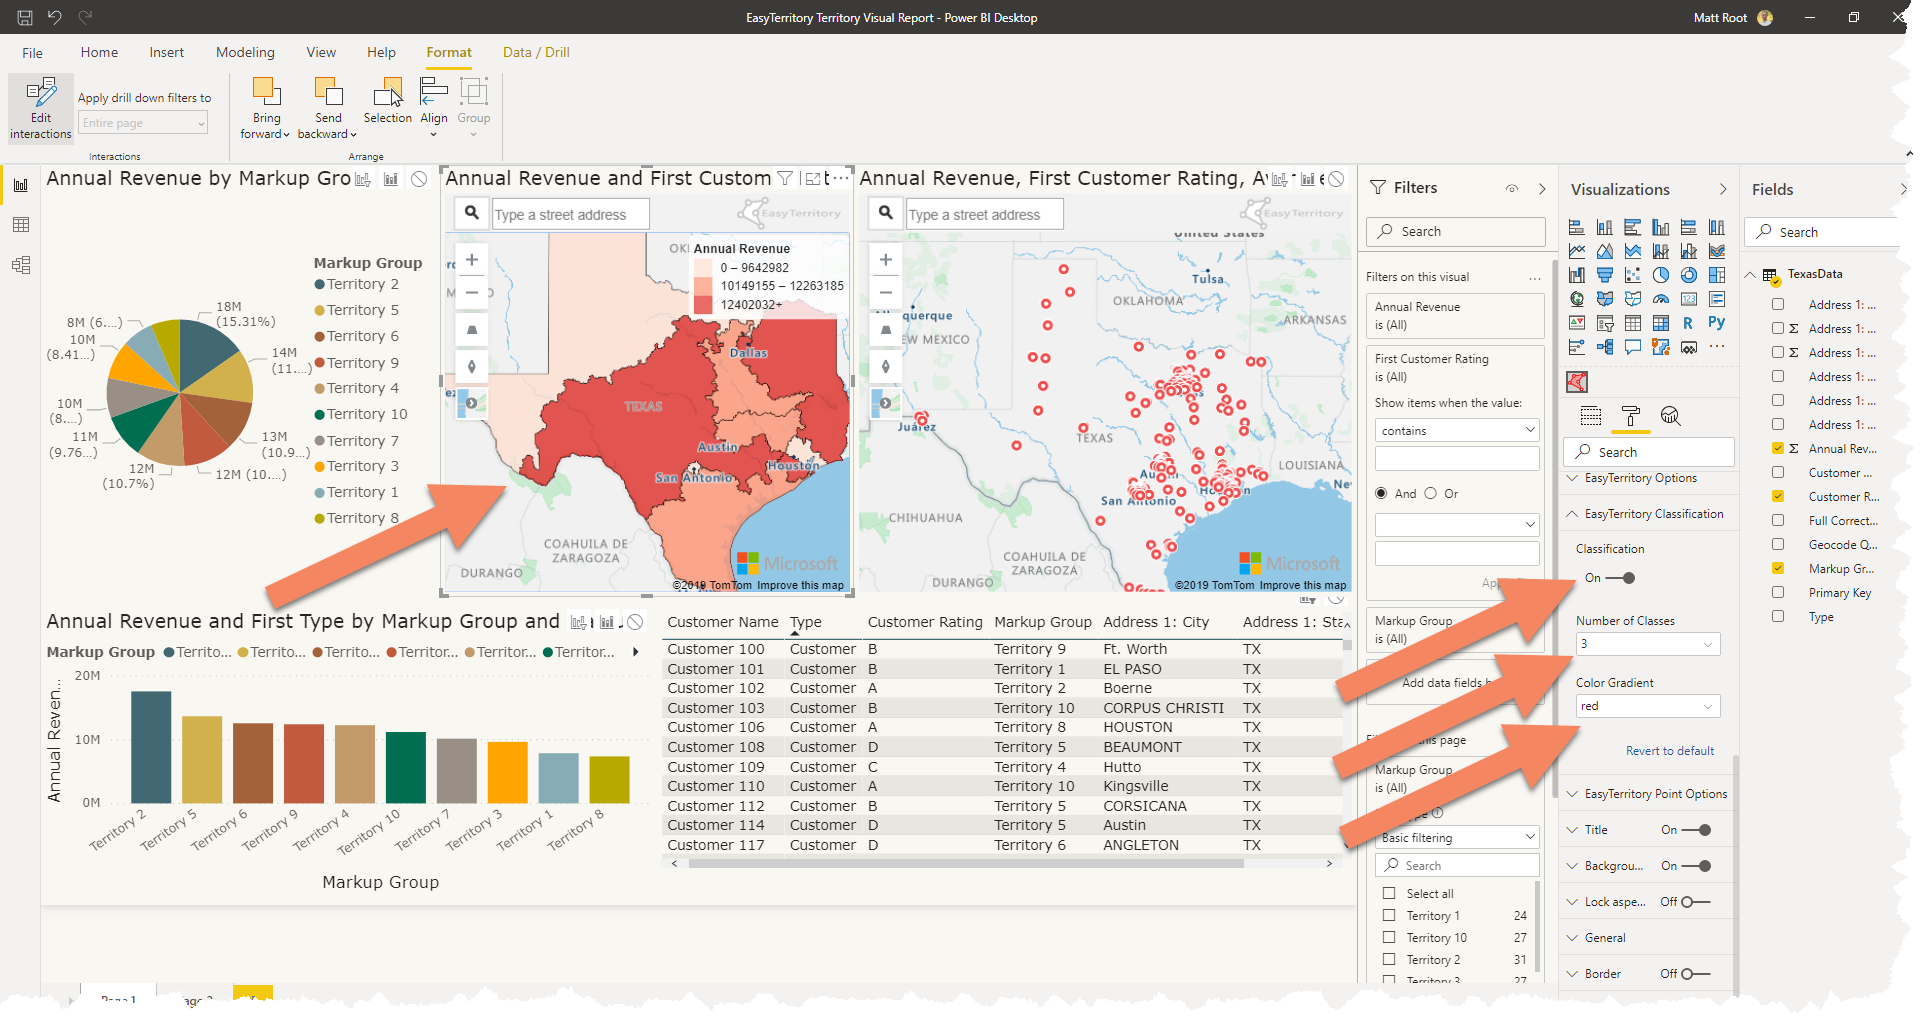
Classifications
- Assign a color gradient to each territory on your map based on an exact or a range of values from the ‘Territory Aggregated Data Column’.
- This is only supported when loading territories.
- This is helpful when analyzing how territories are performing based on a certain metric.
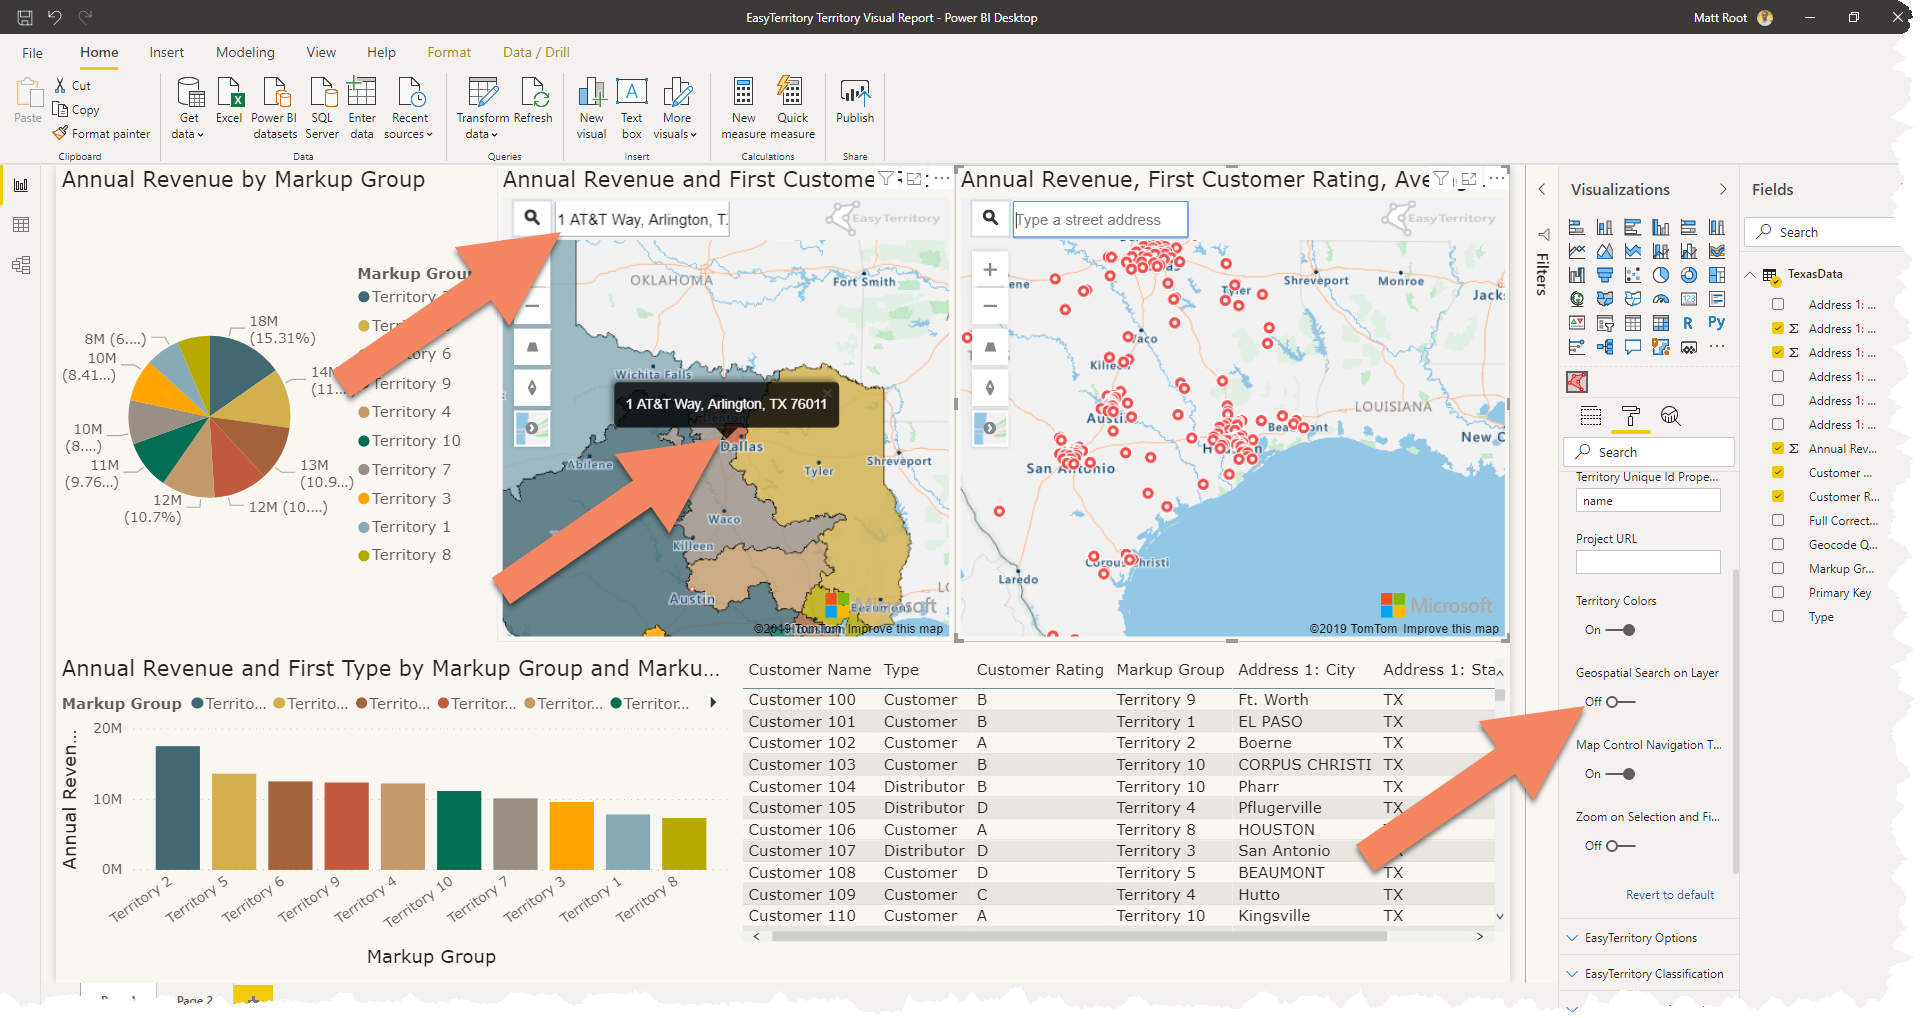
Geospatial Search
- Search for address location to quickly identify what territory the address exists in.
- Or, if you have loaded points in your map, search for the nearest neighbor.
- Make sure under ‘EasyTerritory Map Settings’ that you have set ‘Geospatial search on layer’ to ‘On’.
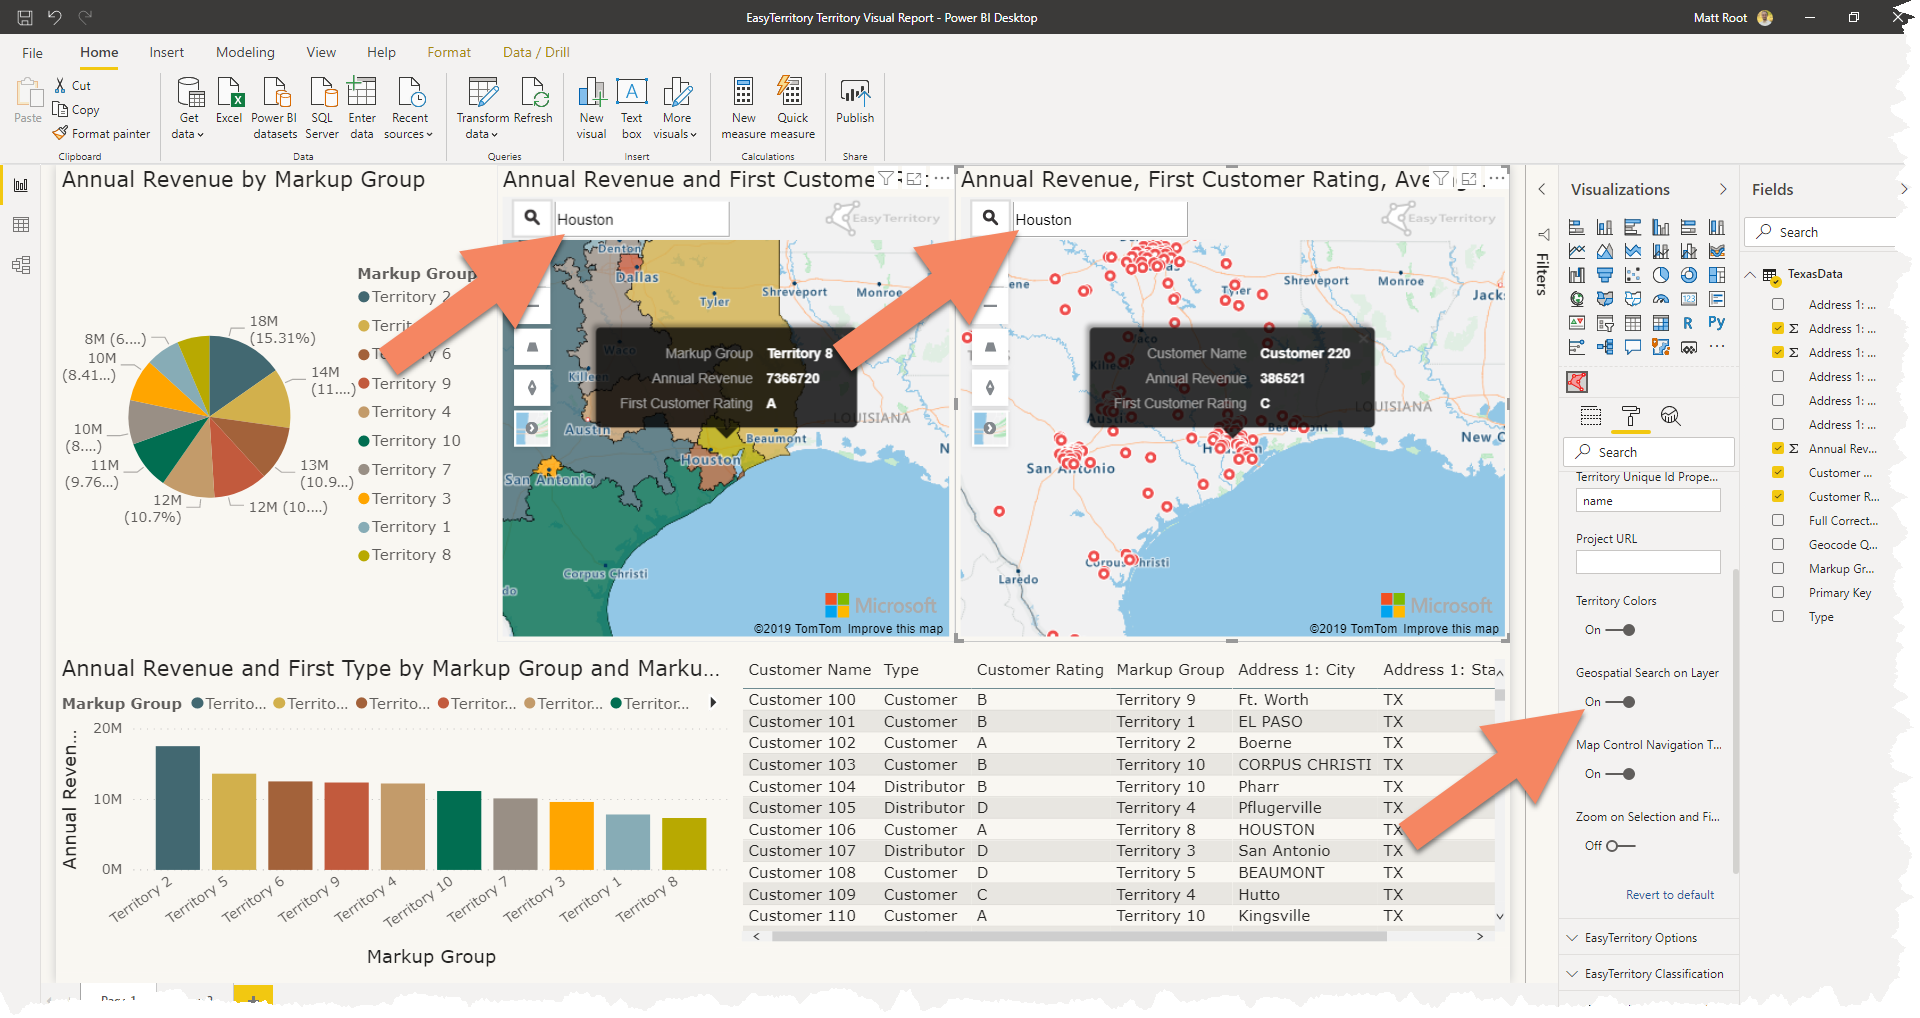
Address Search
-
- Search for address to quickly identify a location on the map.
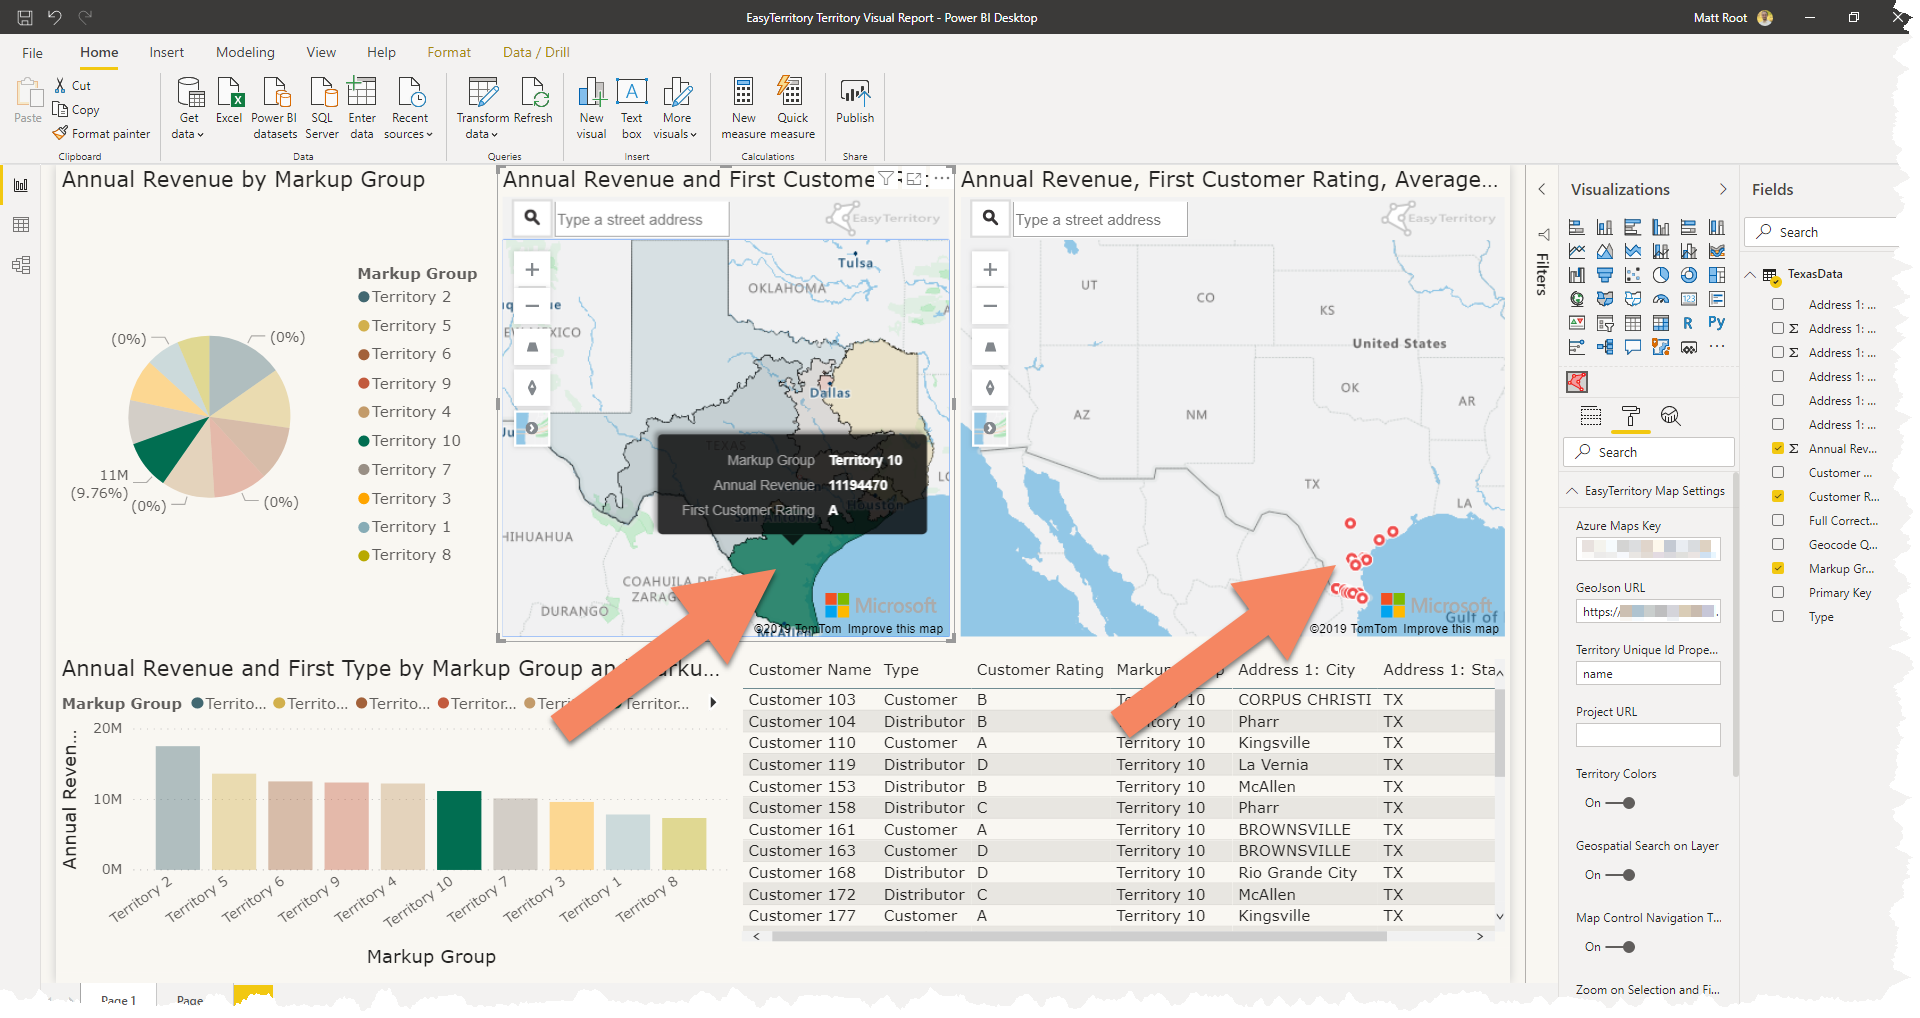
Interaction and Highlighting with other Power BI Visuals
- Click a territory on the map to highlight that territory in the visual and other visuals in your report. You can also click another data point from another Power BI visual within your report to highlight a territory in your EasyTerritory Territory Visual.
- In order to sync colors between the EasyTerritory Visual and other ‘out of the box visuals’ please ensure the column you add to the ‘Aggregated Column’ is the same column you add to the ‘value’ column in other ‘out of the box’ visuals.
- Sometimes, with alot editing to your different visuals your colors might get out-of-sync with your EasyTerritory Visual. To sync the colors please make sure the above step is completed save your report and reload Power BI .
- To turn off multicoloring for territories, go to ‘EasyTerritory Map Settings’ in the format panel and turn ‘Territory Colors’ off.
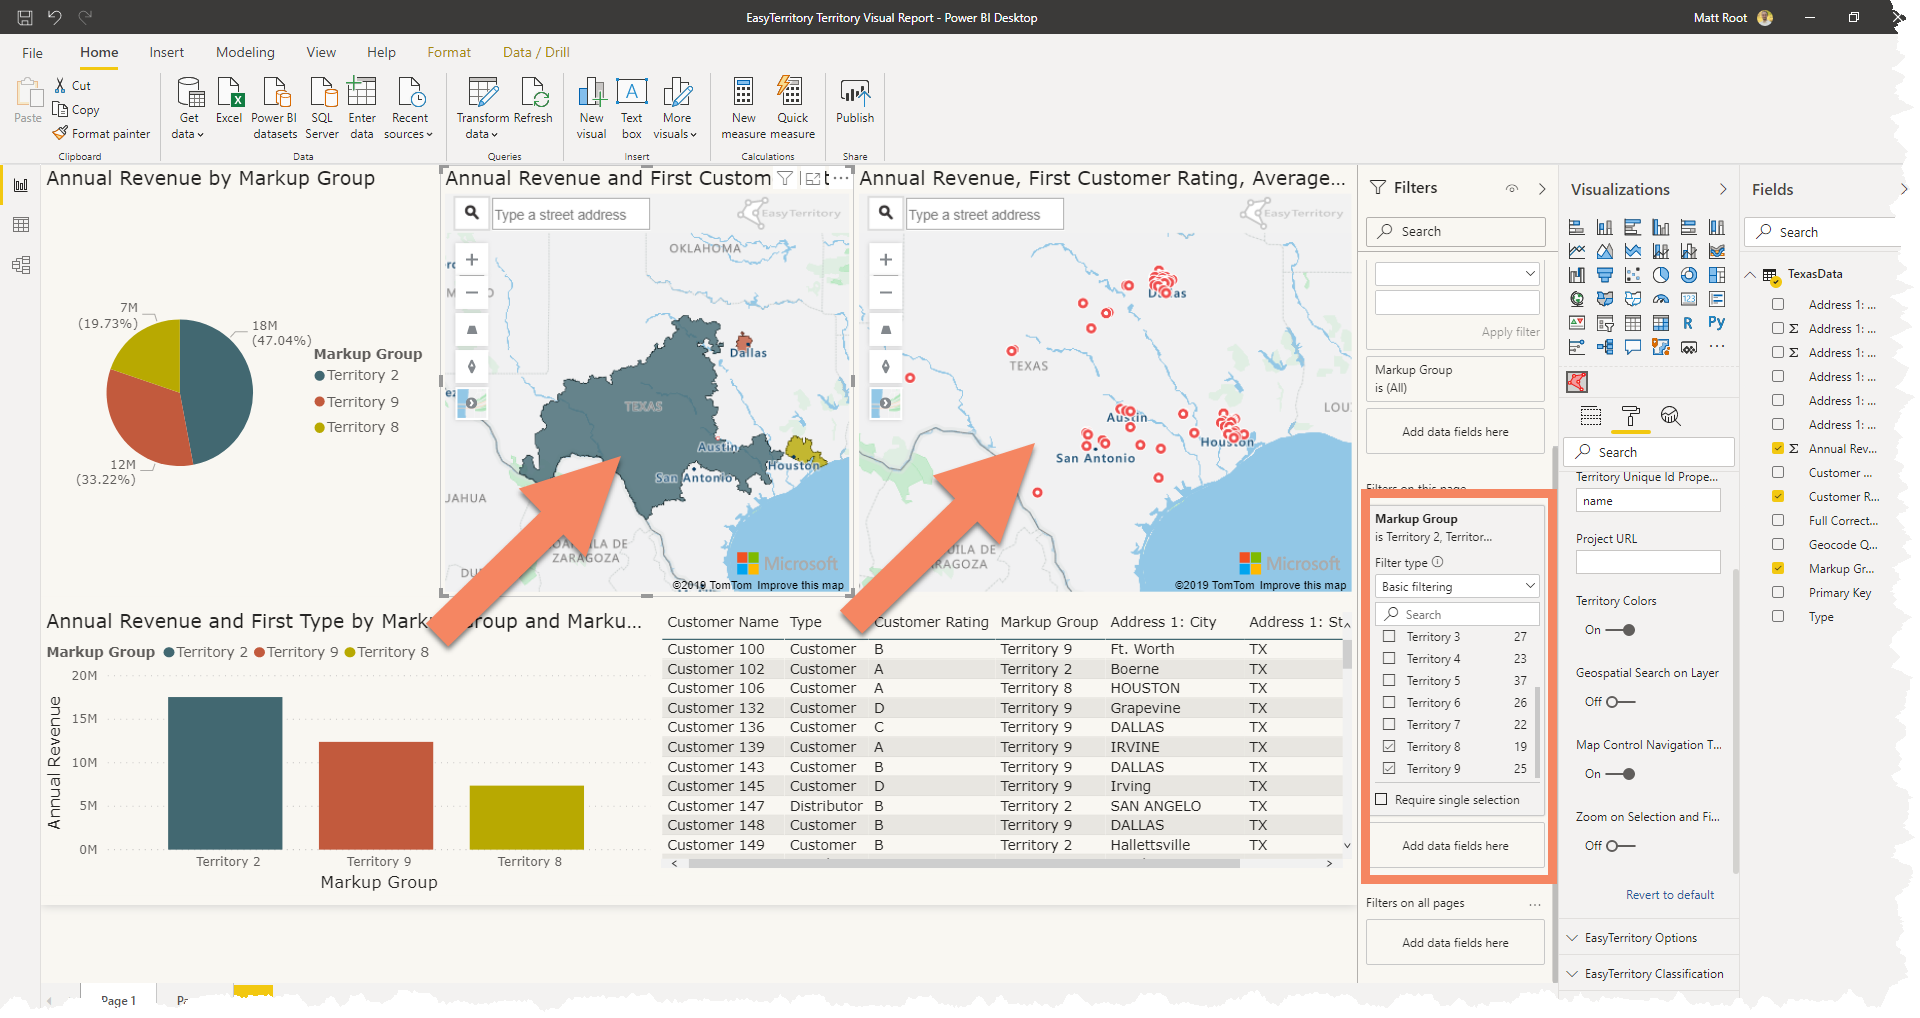
Filtering:
There are two options if you would like to limit the territories that are seen on the map.
- If you would like to filter based on certain field, click the ‘Filters’ icon next to the Visualizations tab.
- Either filter only the EasyTerritory Territroy Visual or all the visuals on the page.
- In the below example, the report is filtering all the visuals on the page based on the ‘markup’ column.
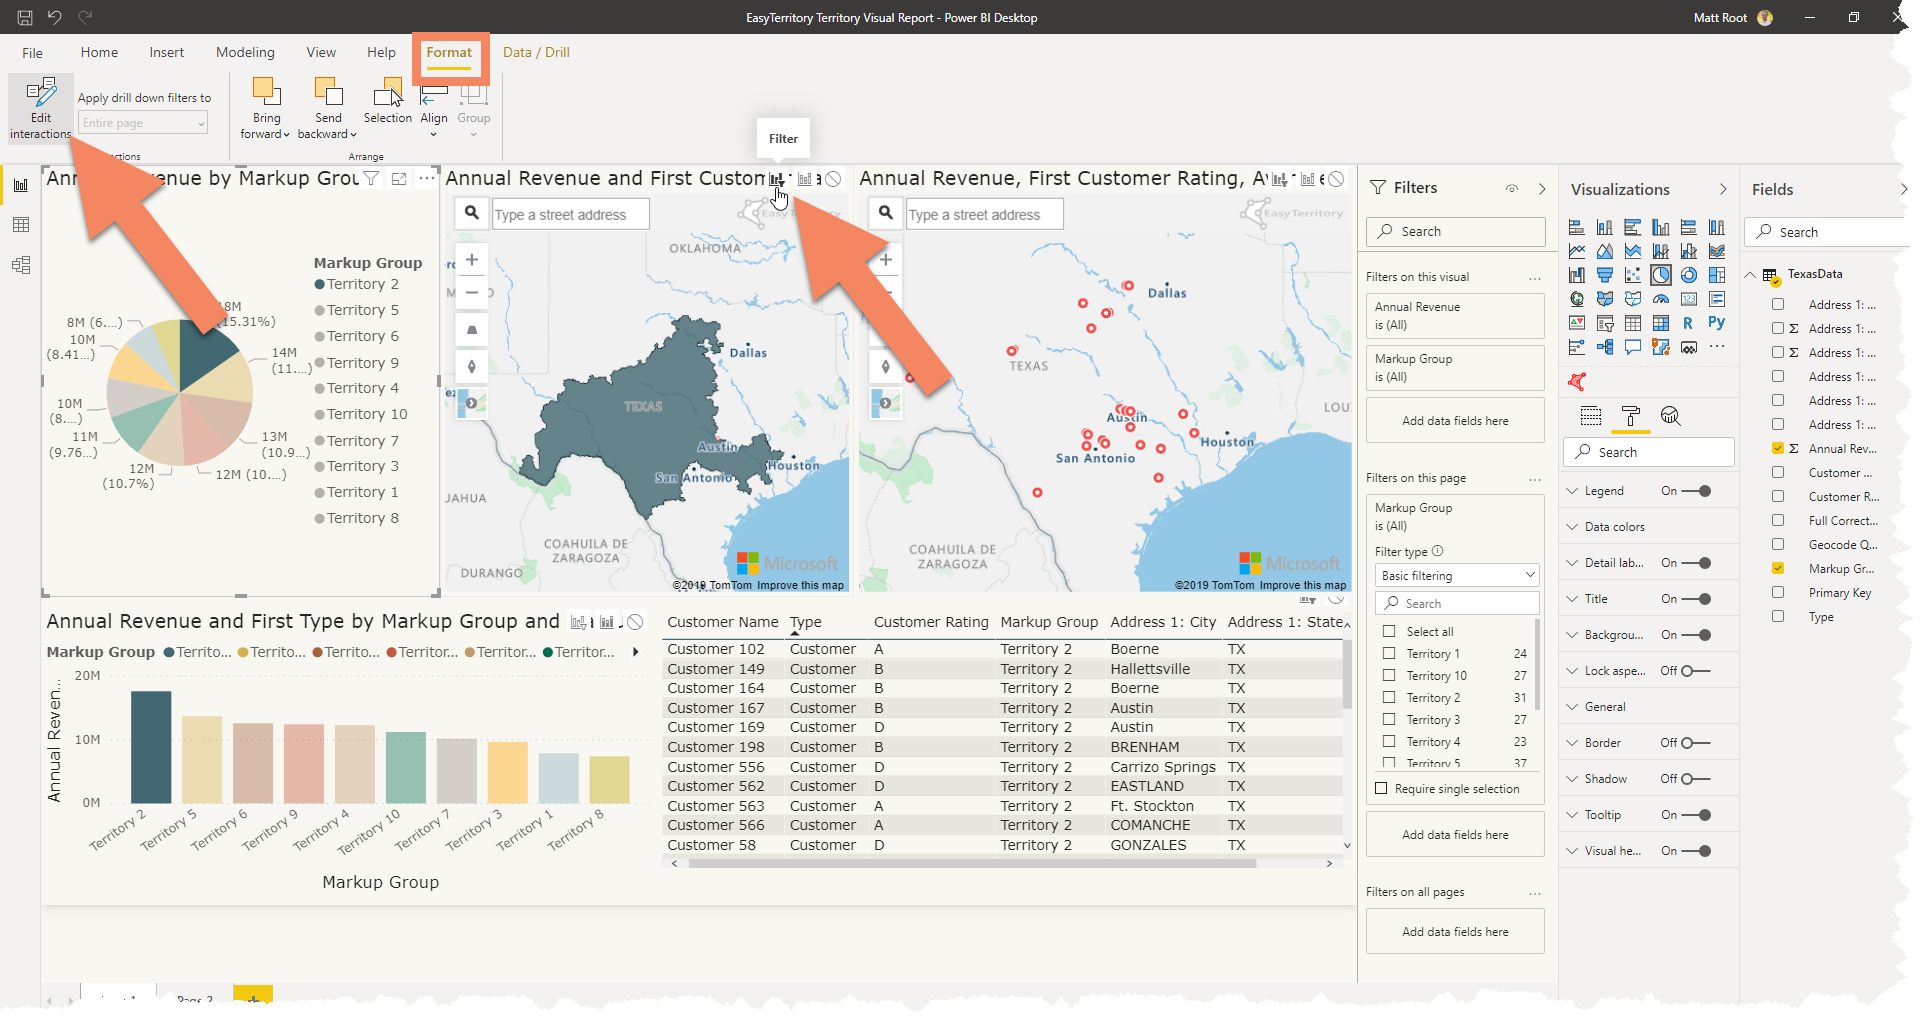
- Second option is to filter based on the selection on another Power BI visual.
- In the menu bar click ‘Format’ > ‘Edit interactions’.
- Next, on the EasyTerritory Territory Visual, select the ‘Filter’ icon.
- In the same steps you can select the ‘Highlight’ icon or the ‘None’ icon.
We’d love to hear from you. If you need any assistance, want to give suggestions, or overall feedback, please email us at sales@easyterritory.com

