Overview:
The EasyTerritory Territory Visual is available to use in Power BI without an EasyTerritory subscription (FREE). You can either load territories or record points onto this visual.
If you would like to demo the visual, please download and unzip our Power BI report that contains territory and point data.
If you do not have a GeoJSON file of your territories, the EasyTerritory Standard and Enterprise edition SaaS product can build it for you! If interested, request a free-trial.
This documentation is divided into three sections. First, directions to load territory data as polygons on the map visual. Second, directions to load record data as points. Third, a review on all the features this visual has to offer.
- Download the latest version of our Power BI Visual from App Source.
- Download a sample Power BI Report that includes a sample data set and the EasyTerritory Territory Visual.
- After downloading unzip the compressed folder to access the Power BI report.
Load territory data:
There are two prerequisites before loading territory data:
- Azure Maps Key
- If you don’t have an Azure Maps Key, no problem, see this documentation to get your own key.
- GeoJSON URL and related territory source data
- Within Power BI, this visual will load a territory data source and bind it to the geoJSON that is defined from the GeoJSON URL provided by the end user in the ‘format panel’. If you need a sample data set and GeoJSON URL to use inorder to see how this visual works, please download our sample Power BI report.
Step 1: Add EasyTerritory Power BI visual and load business data in your Power BI report
- Load your territory data set into Power BI. Make sure there is a column that is a unique identifer for each territory that also exists as a property in your GeoJSON URL. More info on GeoJSON in step 3.
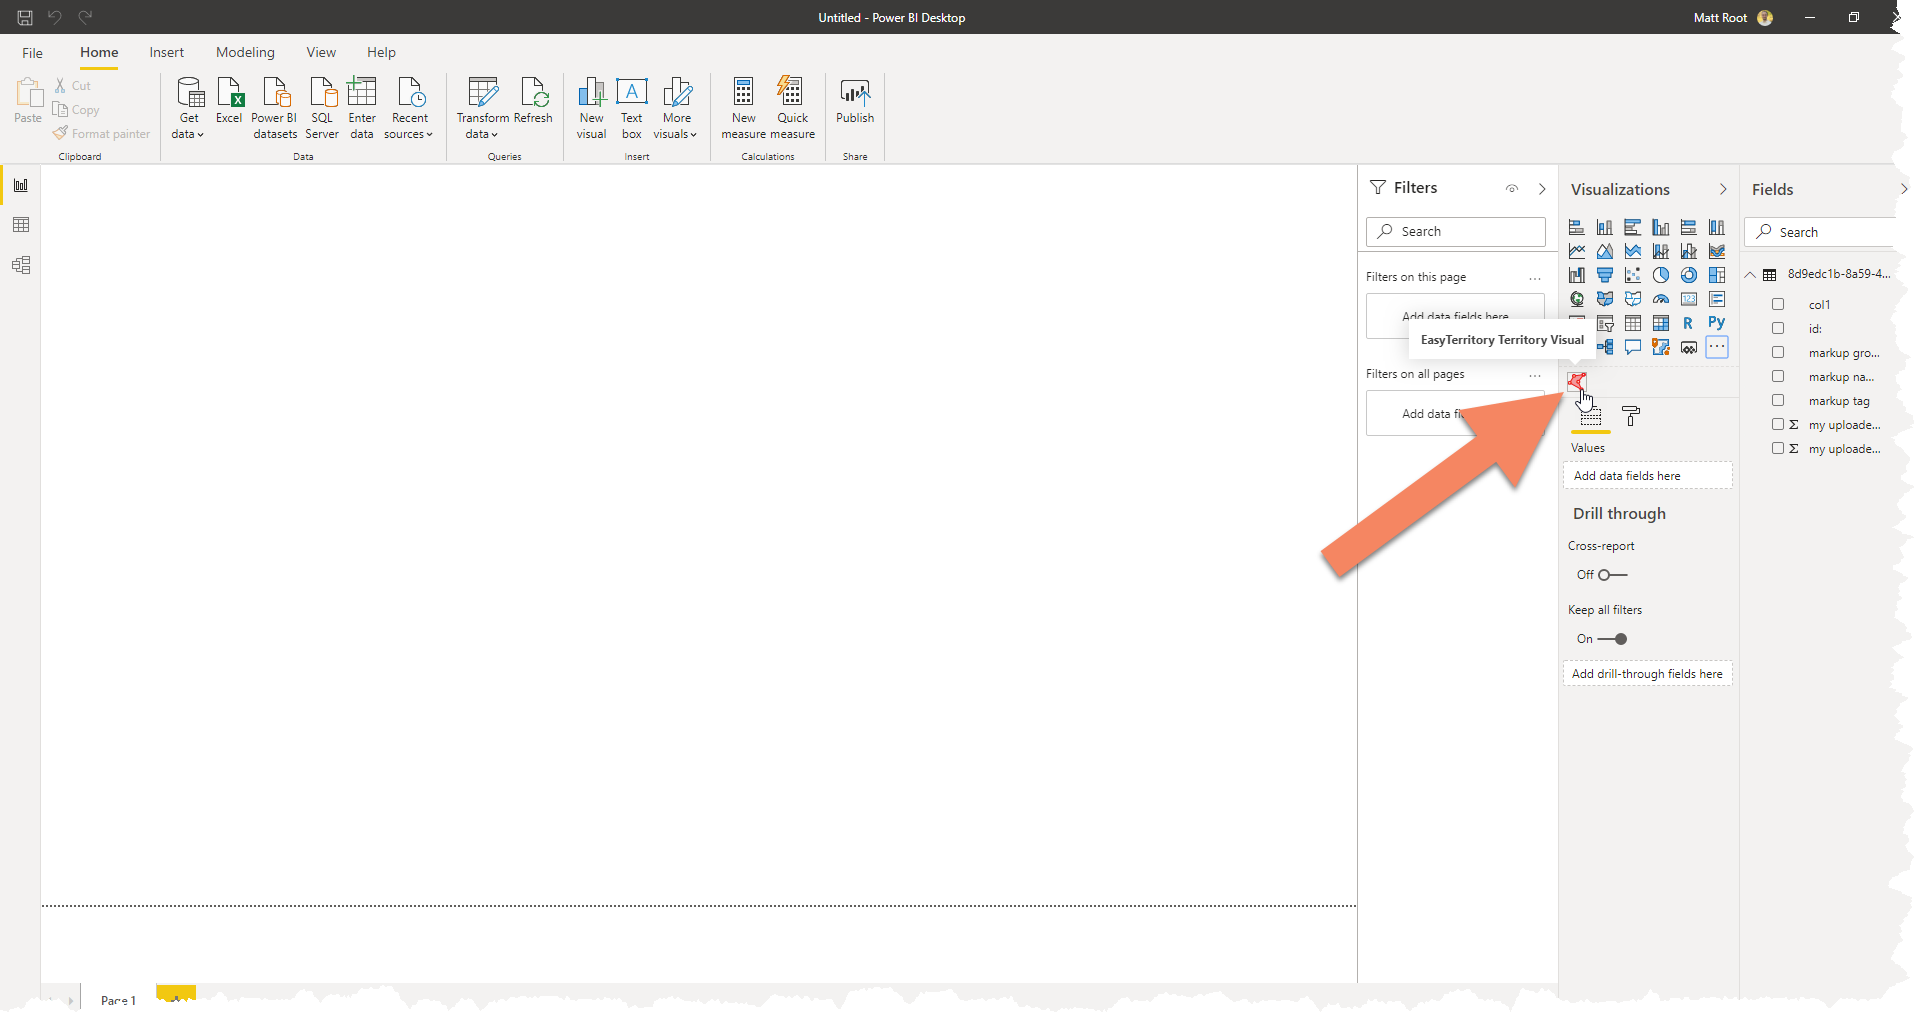
- Click on ‘EasyTerritory Territory Visual’ from the options of visuals inorder to add to the report.
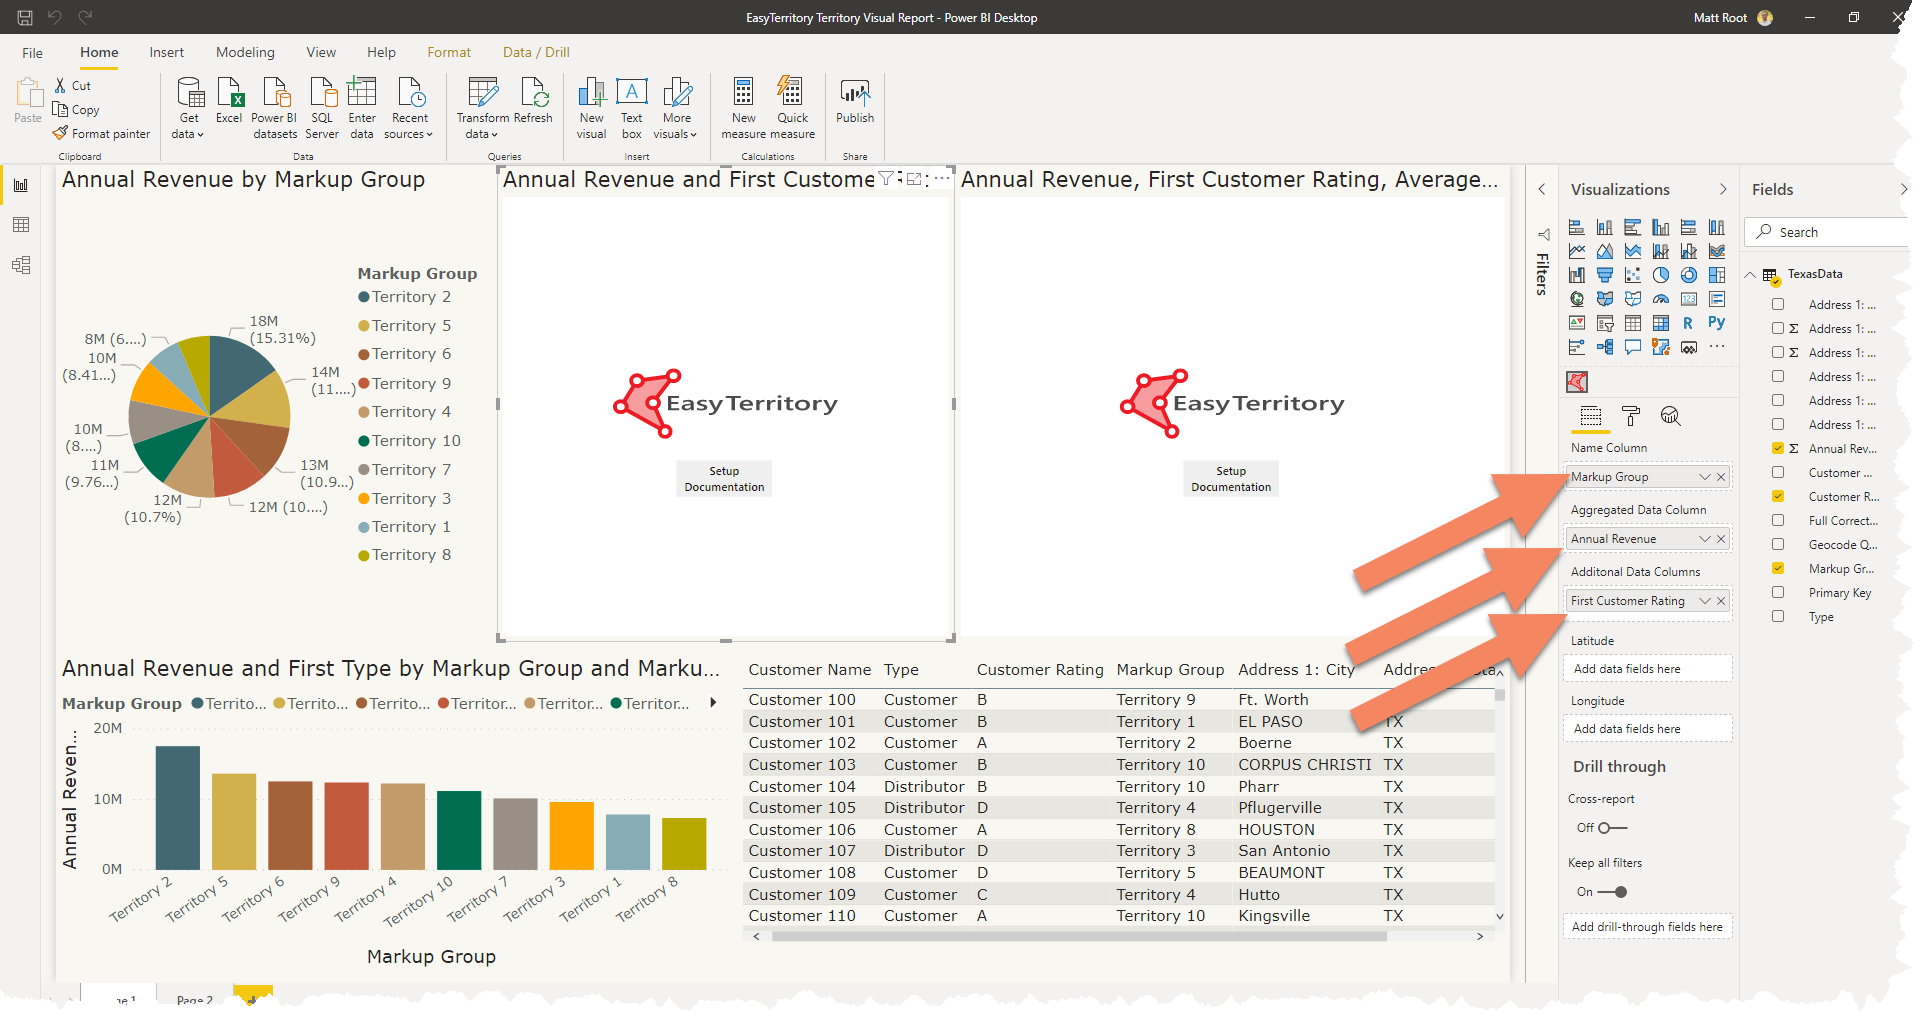
Step 2: Add data source columns from Power BI to the EasyTerritory Visual.
- Required: Add the territory name column from your ‘shape stats’ data source to the ‘Name Column’ category field.
- Required: Add any metric column from your ‘shape stats’ data source into the ‘Aggregated Data Column’ value field.
- To sync your territory colors with other Power BI Visuals, make sure the column you add to the ‘Aggregated column’ is the same as the column added to the ‘values’ field in other Power BI visuals in your report. For more info on this go to the Interactions and Highlighting section.
- Optional: Add any column you would like from your ‘shape stats’ to the ‘Additional Data Columns’ to hold data to display in the tool tips.
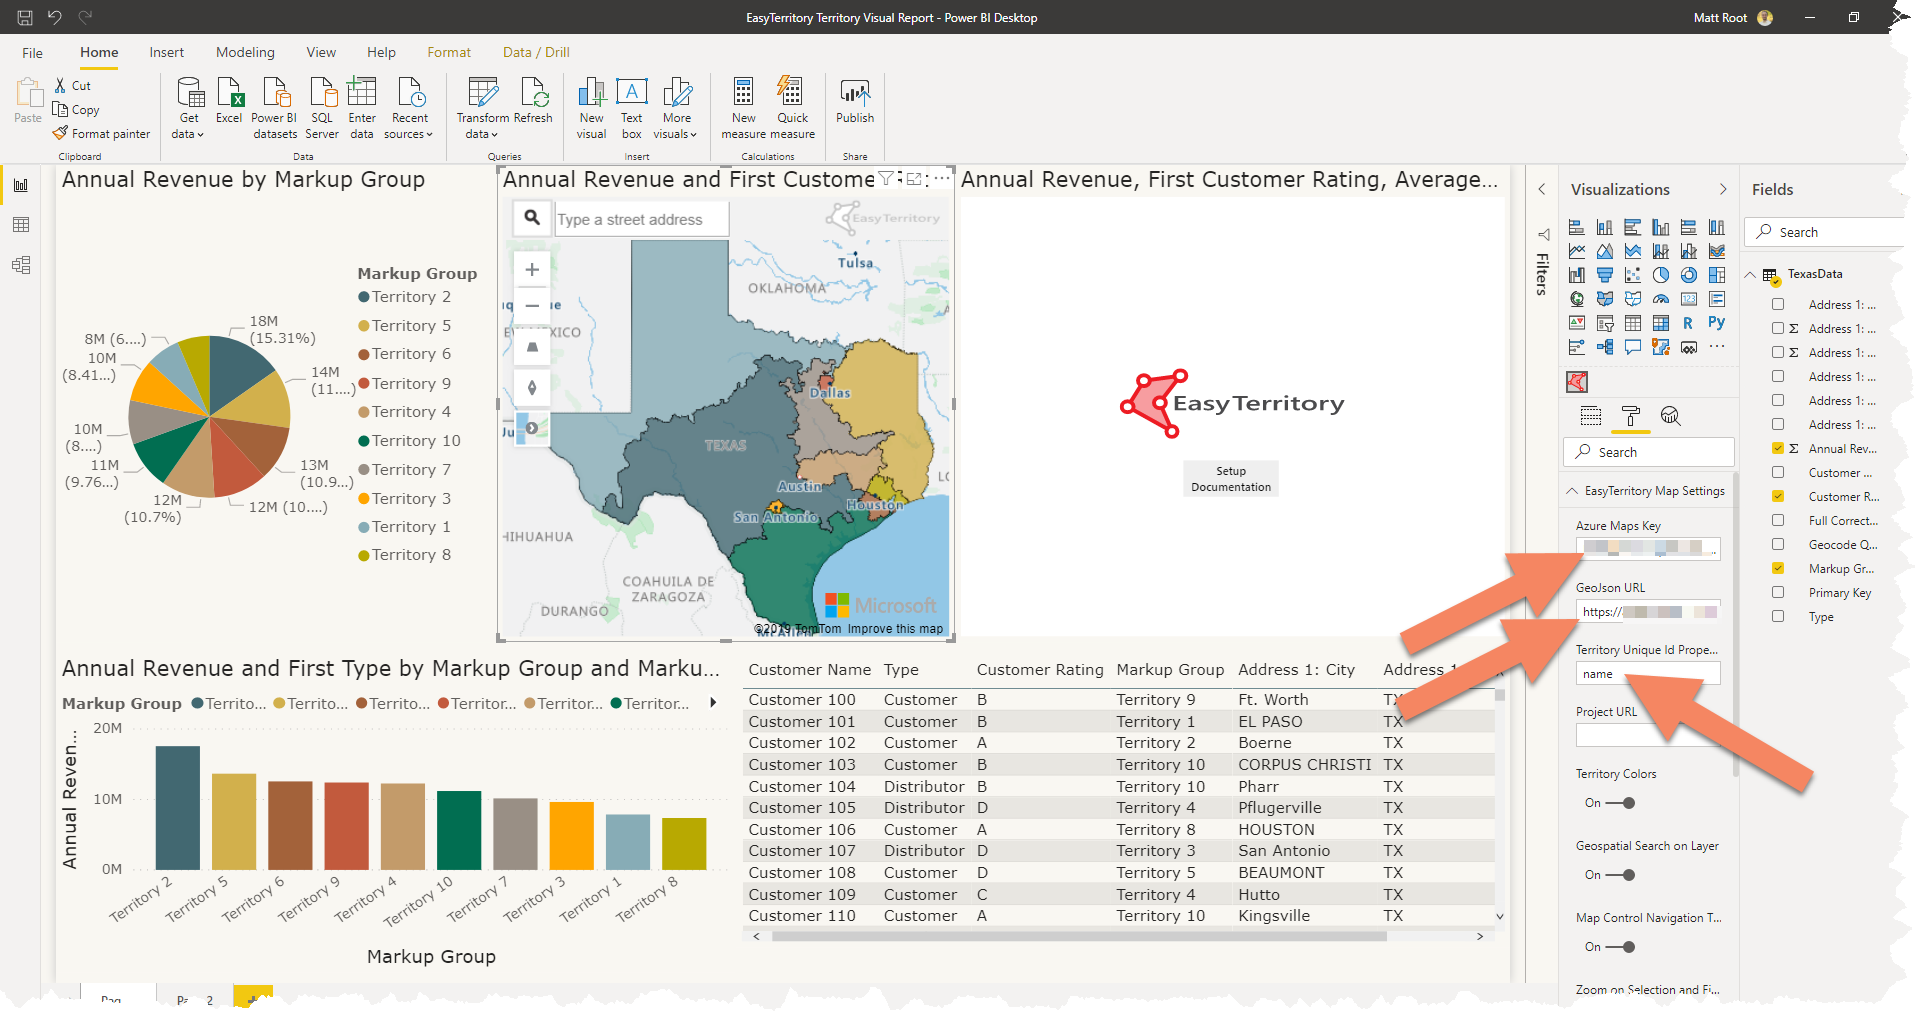
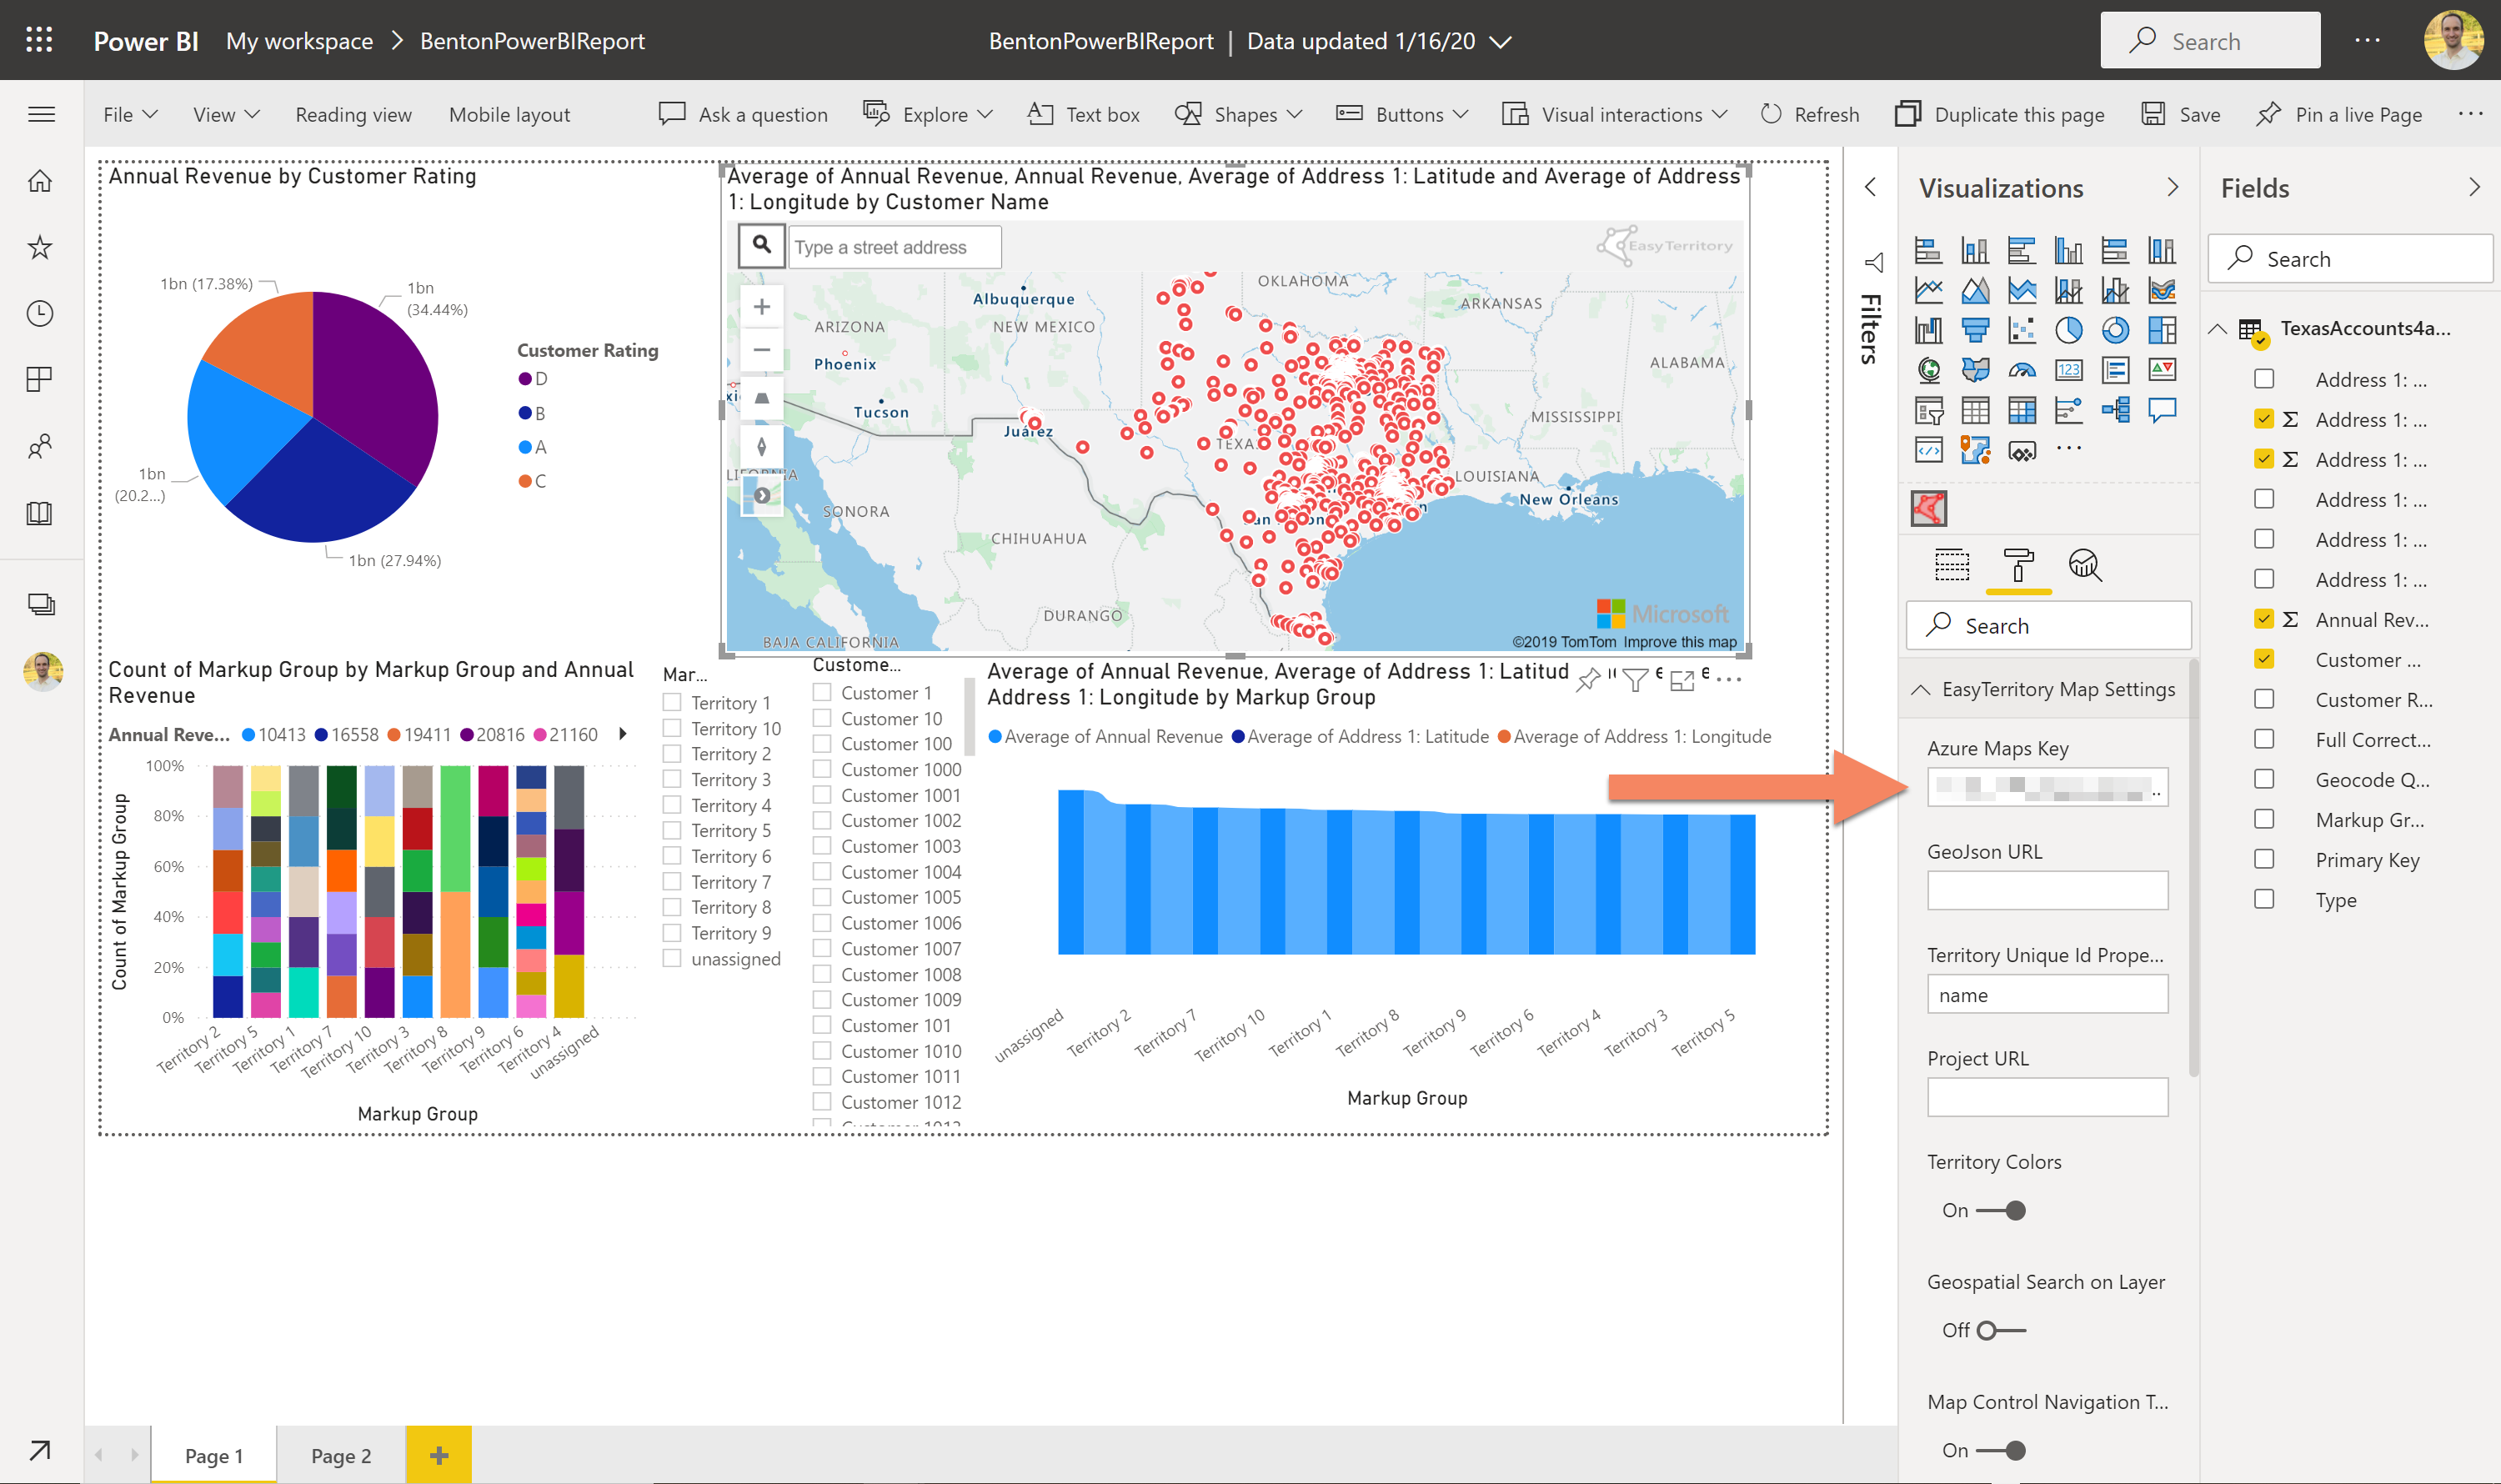
Step 3: Enter Azure Maps Key and GeoJson URL
- If you do not have an Azure Maps key, no problem. Directions on how to get a free Azure Maps Key here.
- Required: Enter your Azure Maps Key in the ‘EasyTerritory Map Settings’ section of the format panel in Power BI.
- Required: Enter the URL of the GeoJSON (this must be HTTPS) in ‘EasyTerritory Map Settings’ Section of the format Panel in Power BI.
- GeoJSON is a format for encoding a variety of geographic data structures.
- Your GeoJSON URL can reside in a file share, or cloud storage as long as it can be accessed publically and is a .json or .geojson extension.
- For a sample GeoJSON URL please download the Power BI sample report.
- Required: Enter the property from your GeoJSON that holds the value of the ‘Name Column’ from the ‘Fields Panel’.
- If you are using the Power BI sample report leave the value as name.
Load Point data:
There are two prerequisites before loading point data:
- Azure Maps Key
- If you don’t have an Azure Maps Key, no problem, visit this documentation to get your own key.
- Latitude and longitude columns in your data source
Step 1: Add EasyTerritory Power BI visual and load business data in your Power BI report
- Load your record data set into Power BI. Make sure there is a latitude and longitude column in your data.
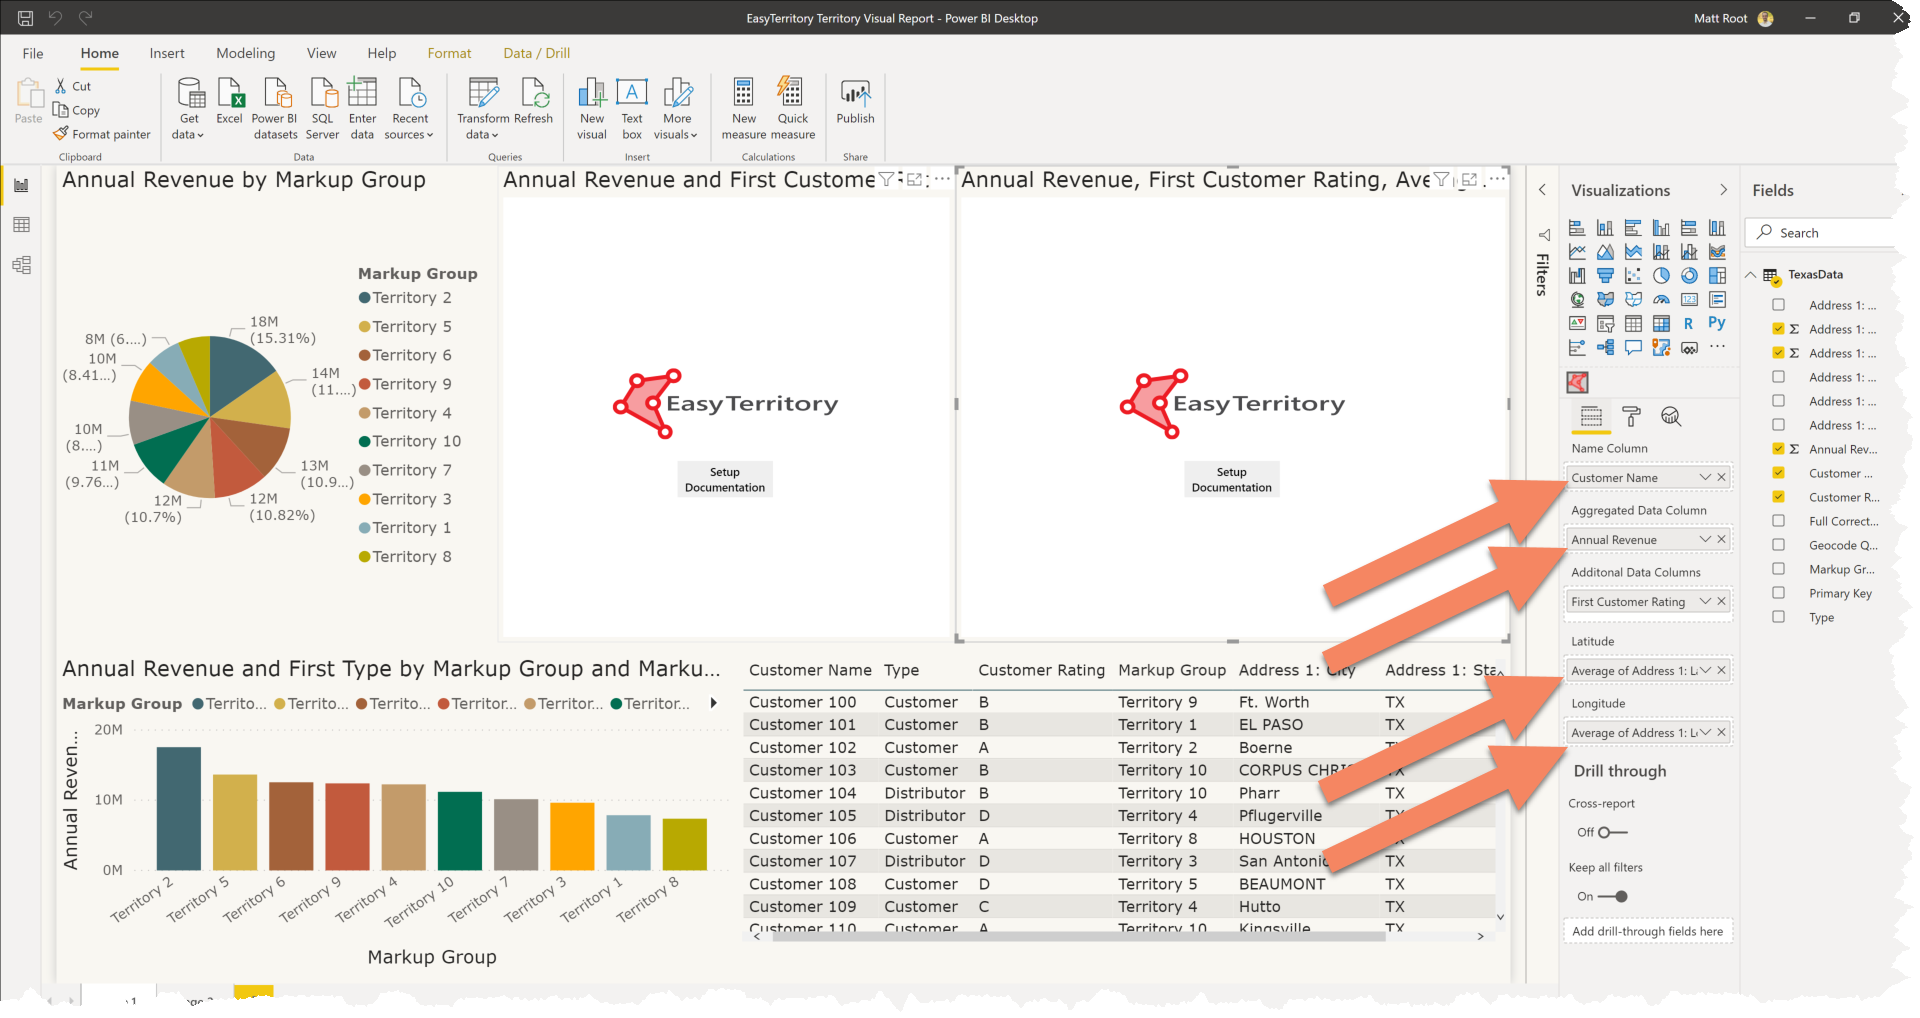
Step 2: Add data source columns from Power BI to the EasyTerritory Visual.
- Required: Add the record ‘name’ column of your data source into the ‘Name Column’ category field.
- Required: Add any metric column from your data source into the the ‘Aggregated Value’ value field.
- Required: Add the latitude and longitude columns.
- Optional: Add any column you would like to the ‘Additional Data Columns’ to hold data to display in the tool tips.
Step 3: Enter Azure Maps Key
- If you do not have an Azure Maps key, no problem. Directions on how to get a free Azure Maps Key.
- Required: Enter your Azure Maps Key in the ‘EasyTerritory Map Settings’ section of the format panel in Power BI.
Next…
EasyTerritory Visual features
We’d love to hear from you. If you need any assistance, want to give suggestions, or overall feedback, please email us at sales@easyterritory.com

