EasyTerritory Territory Visual for Power BI Configuration with Lat/Lon Point Data

Overview:

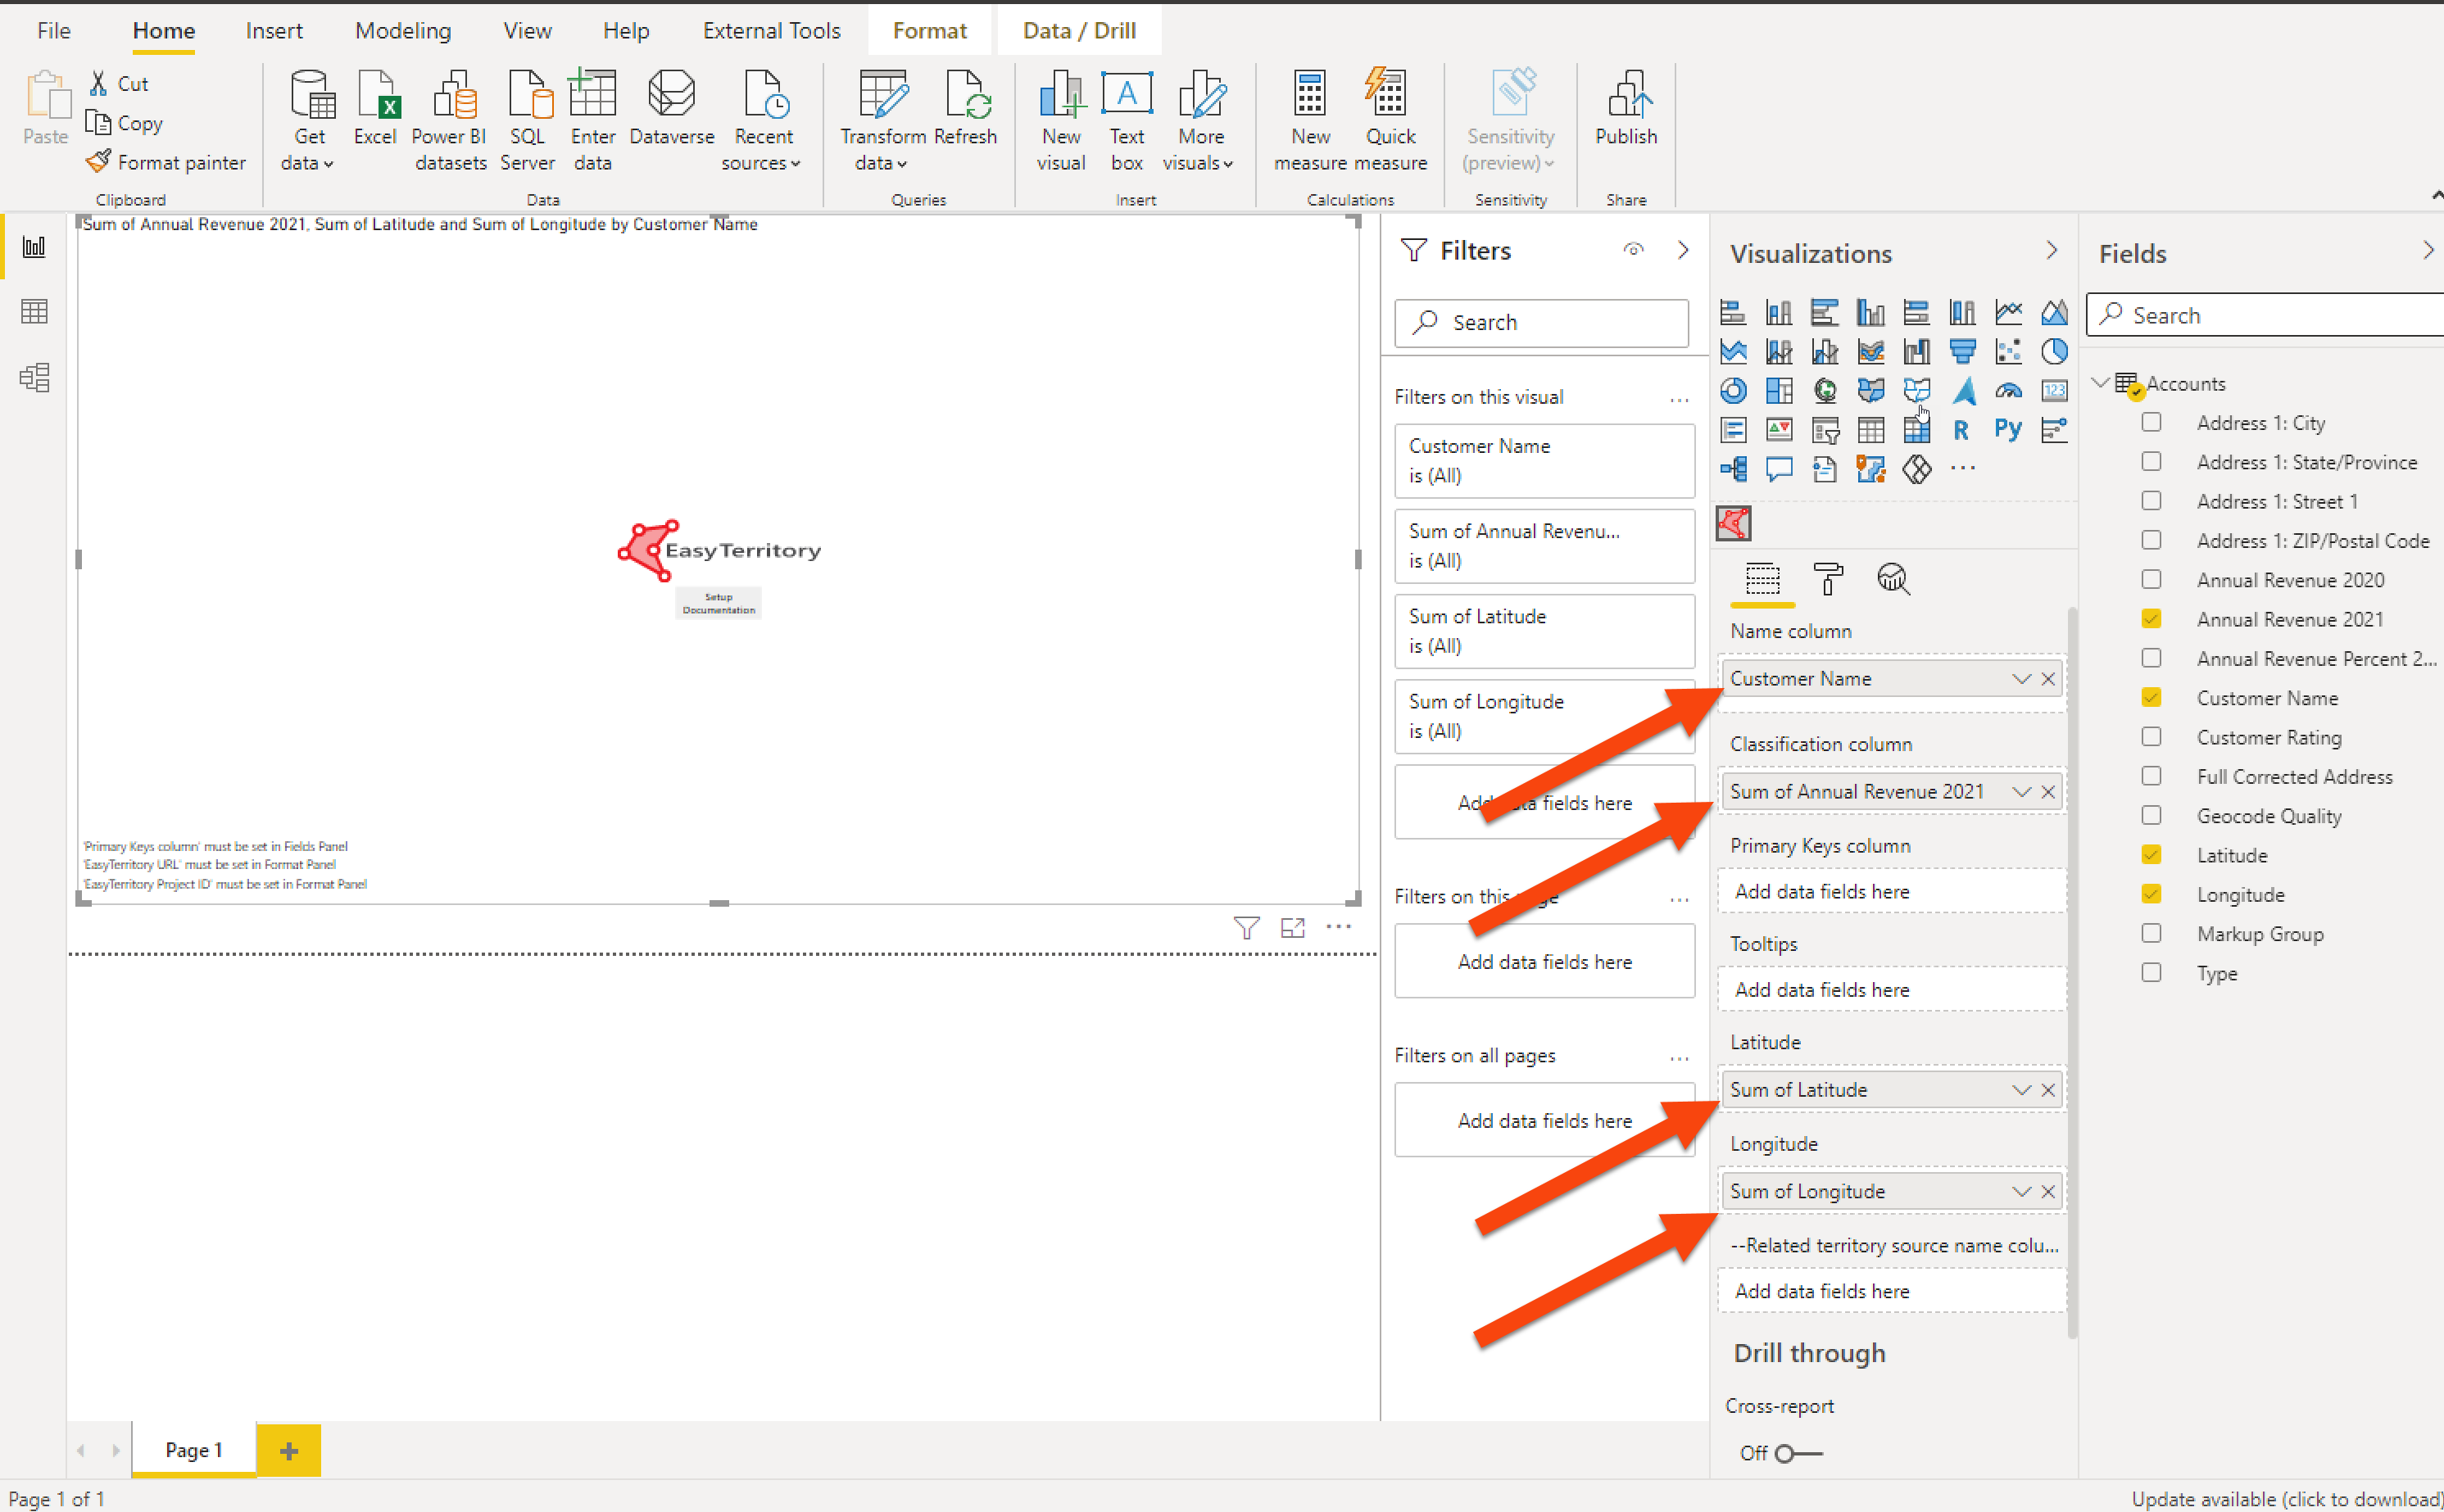
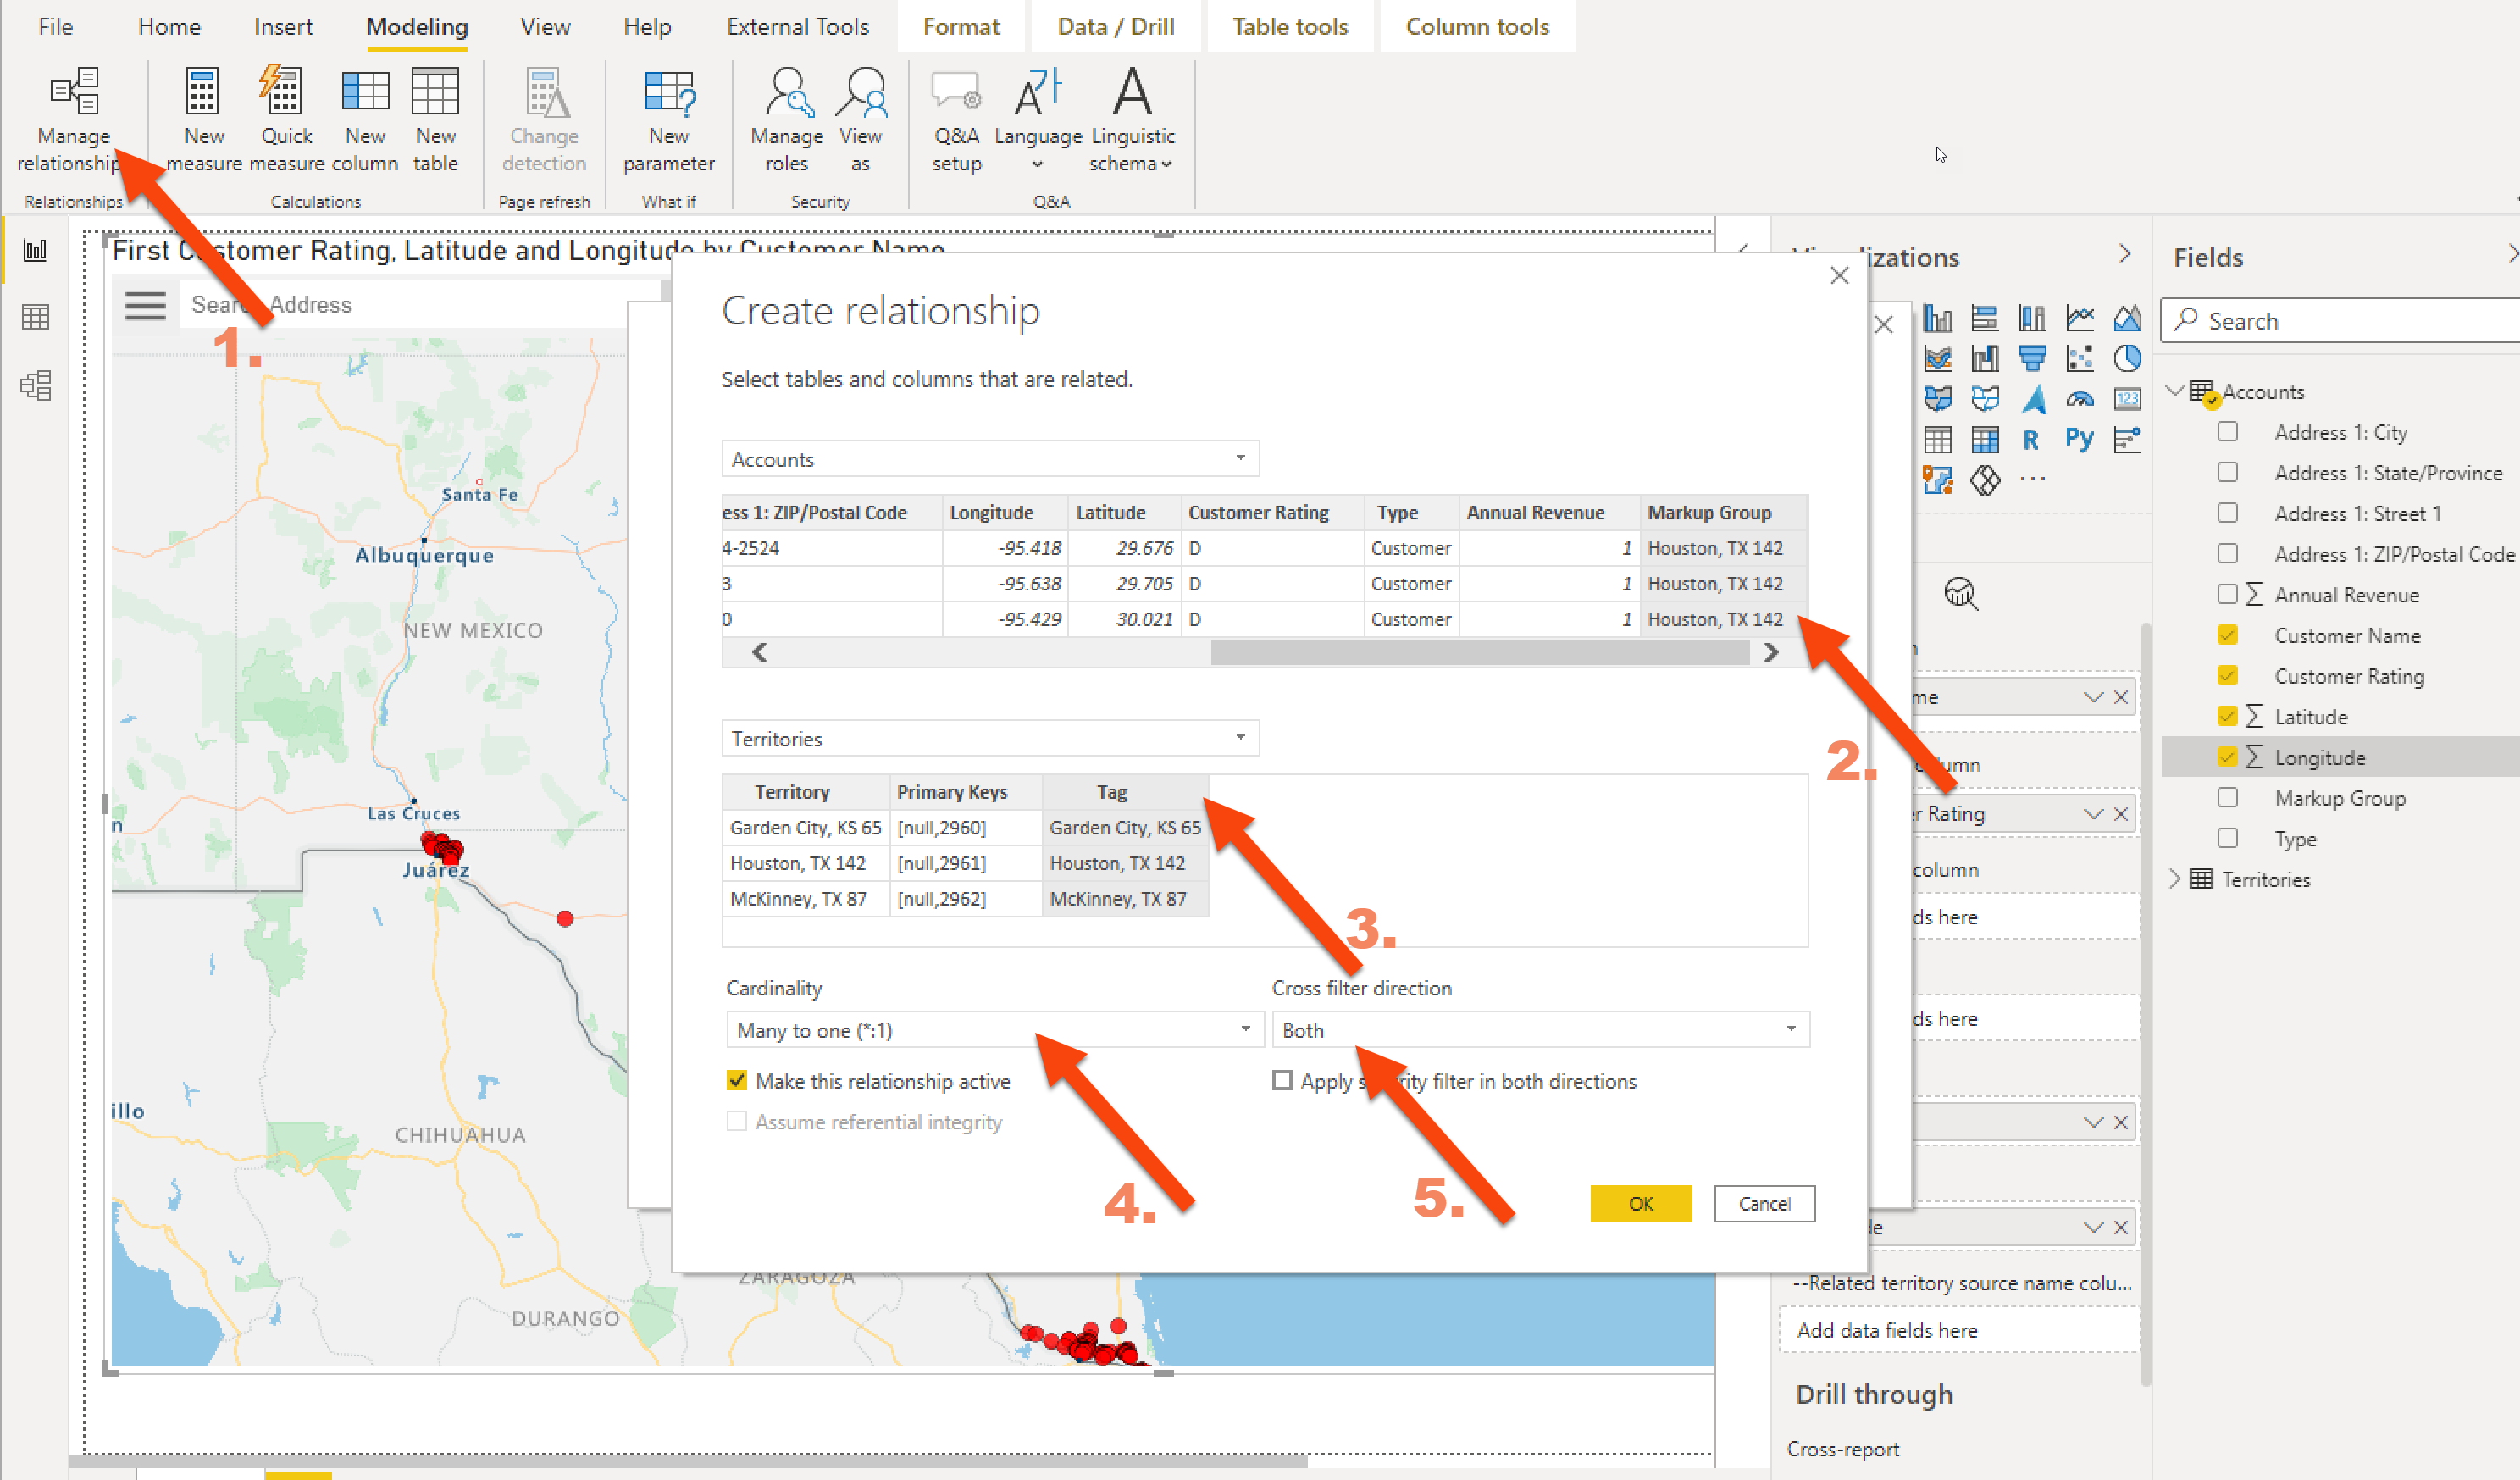
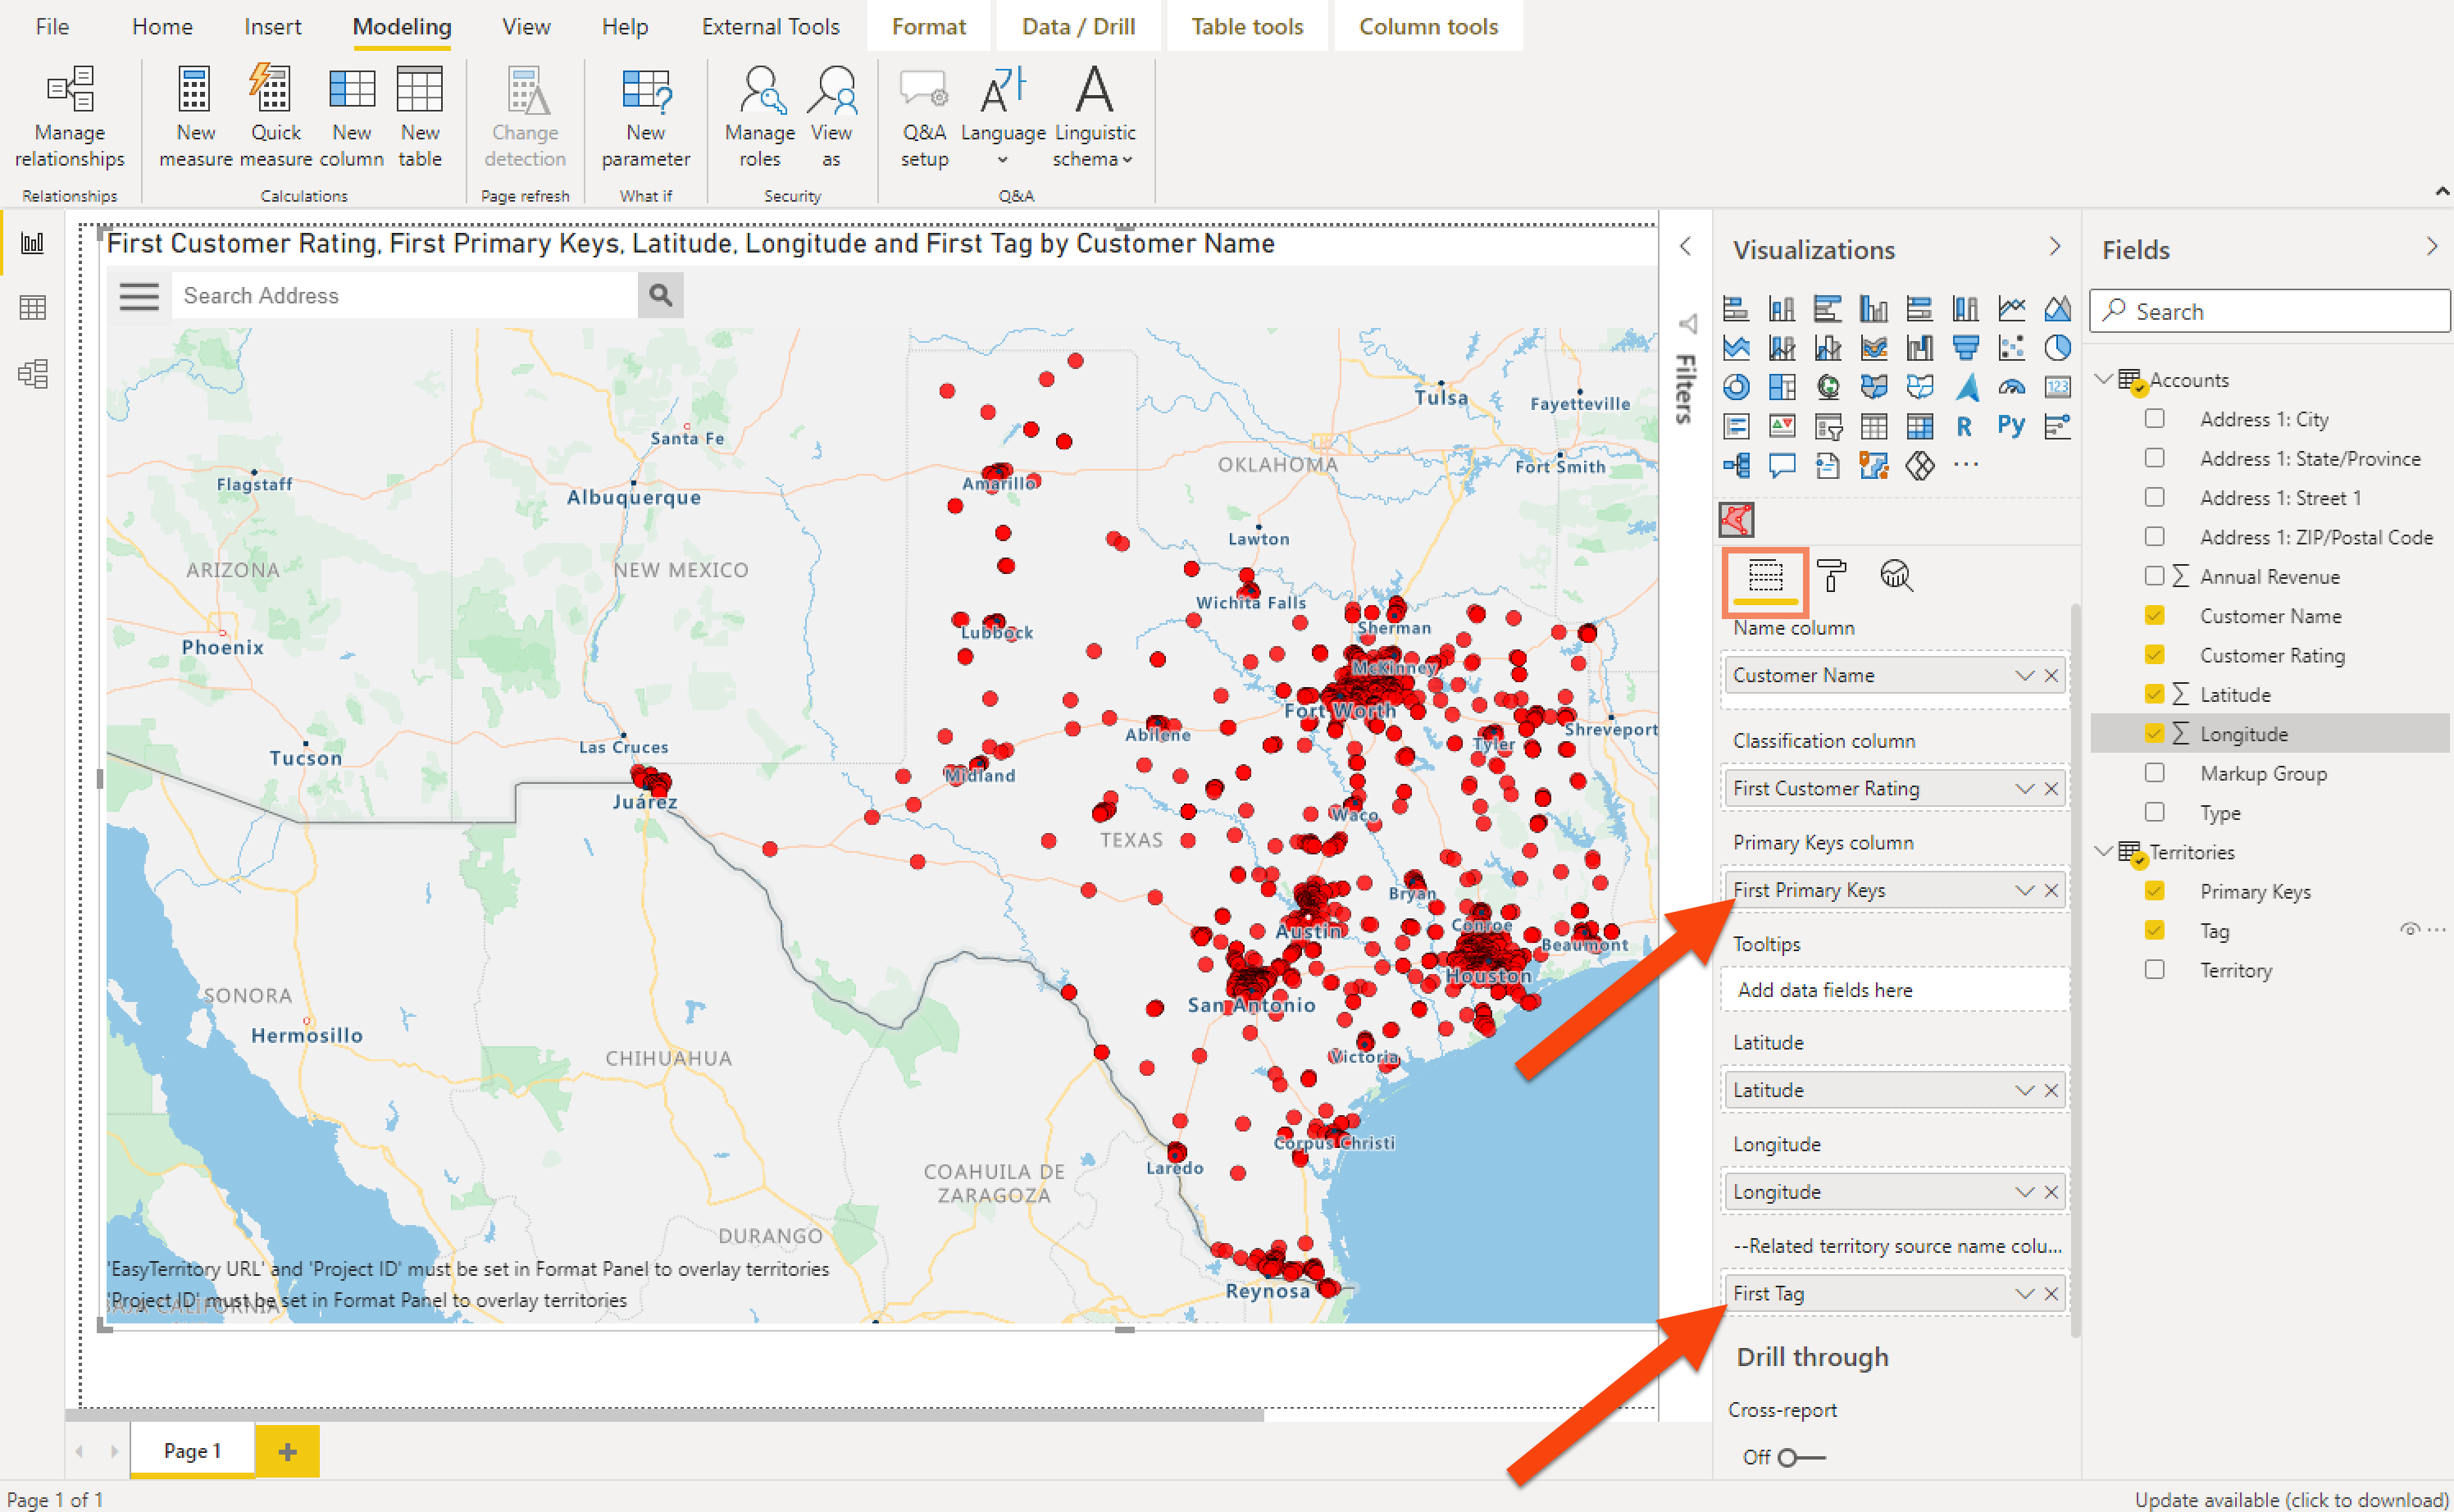
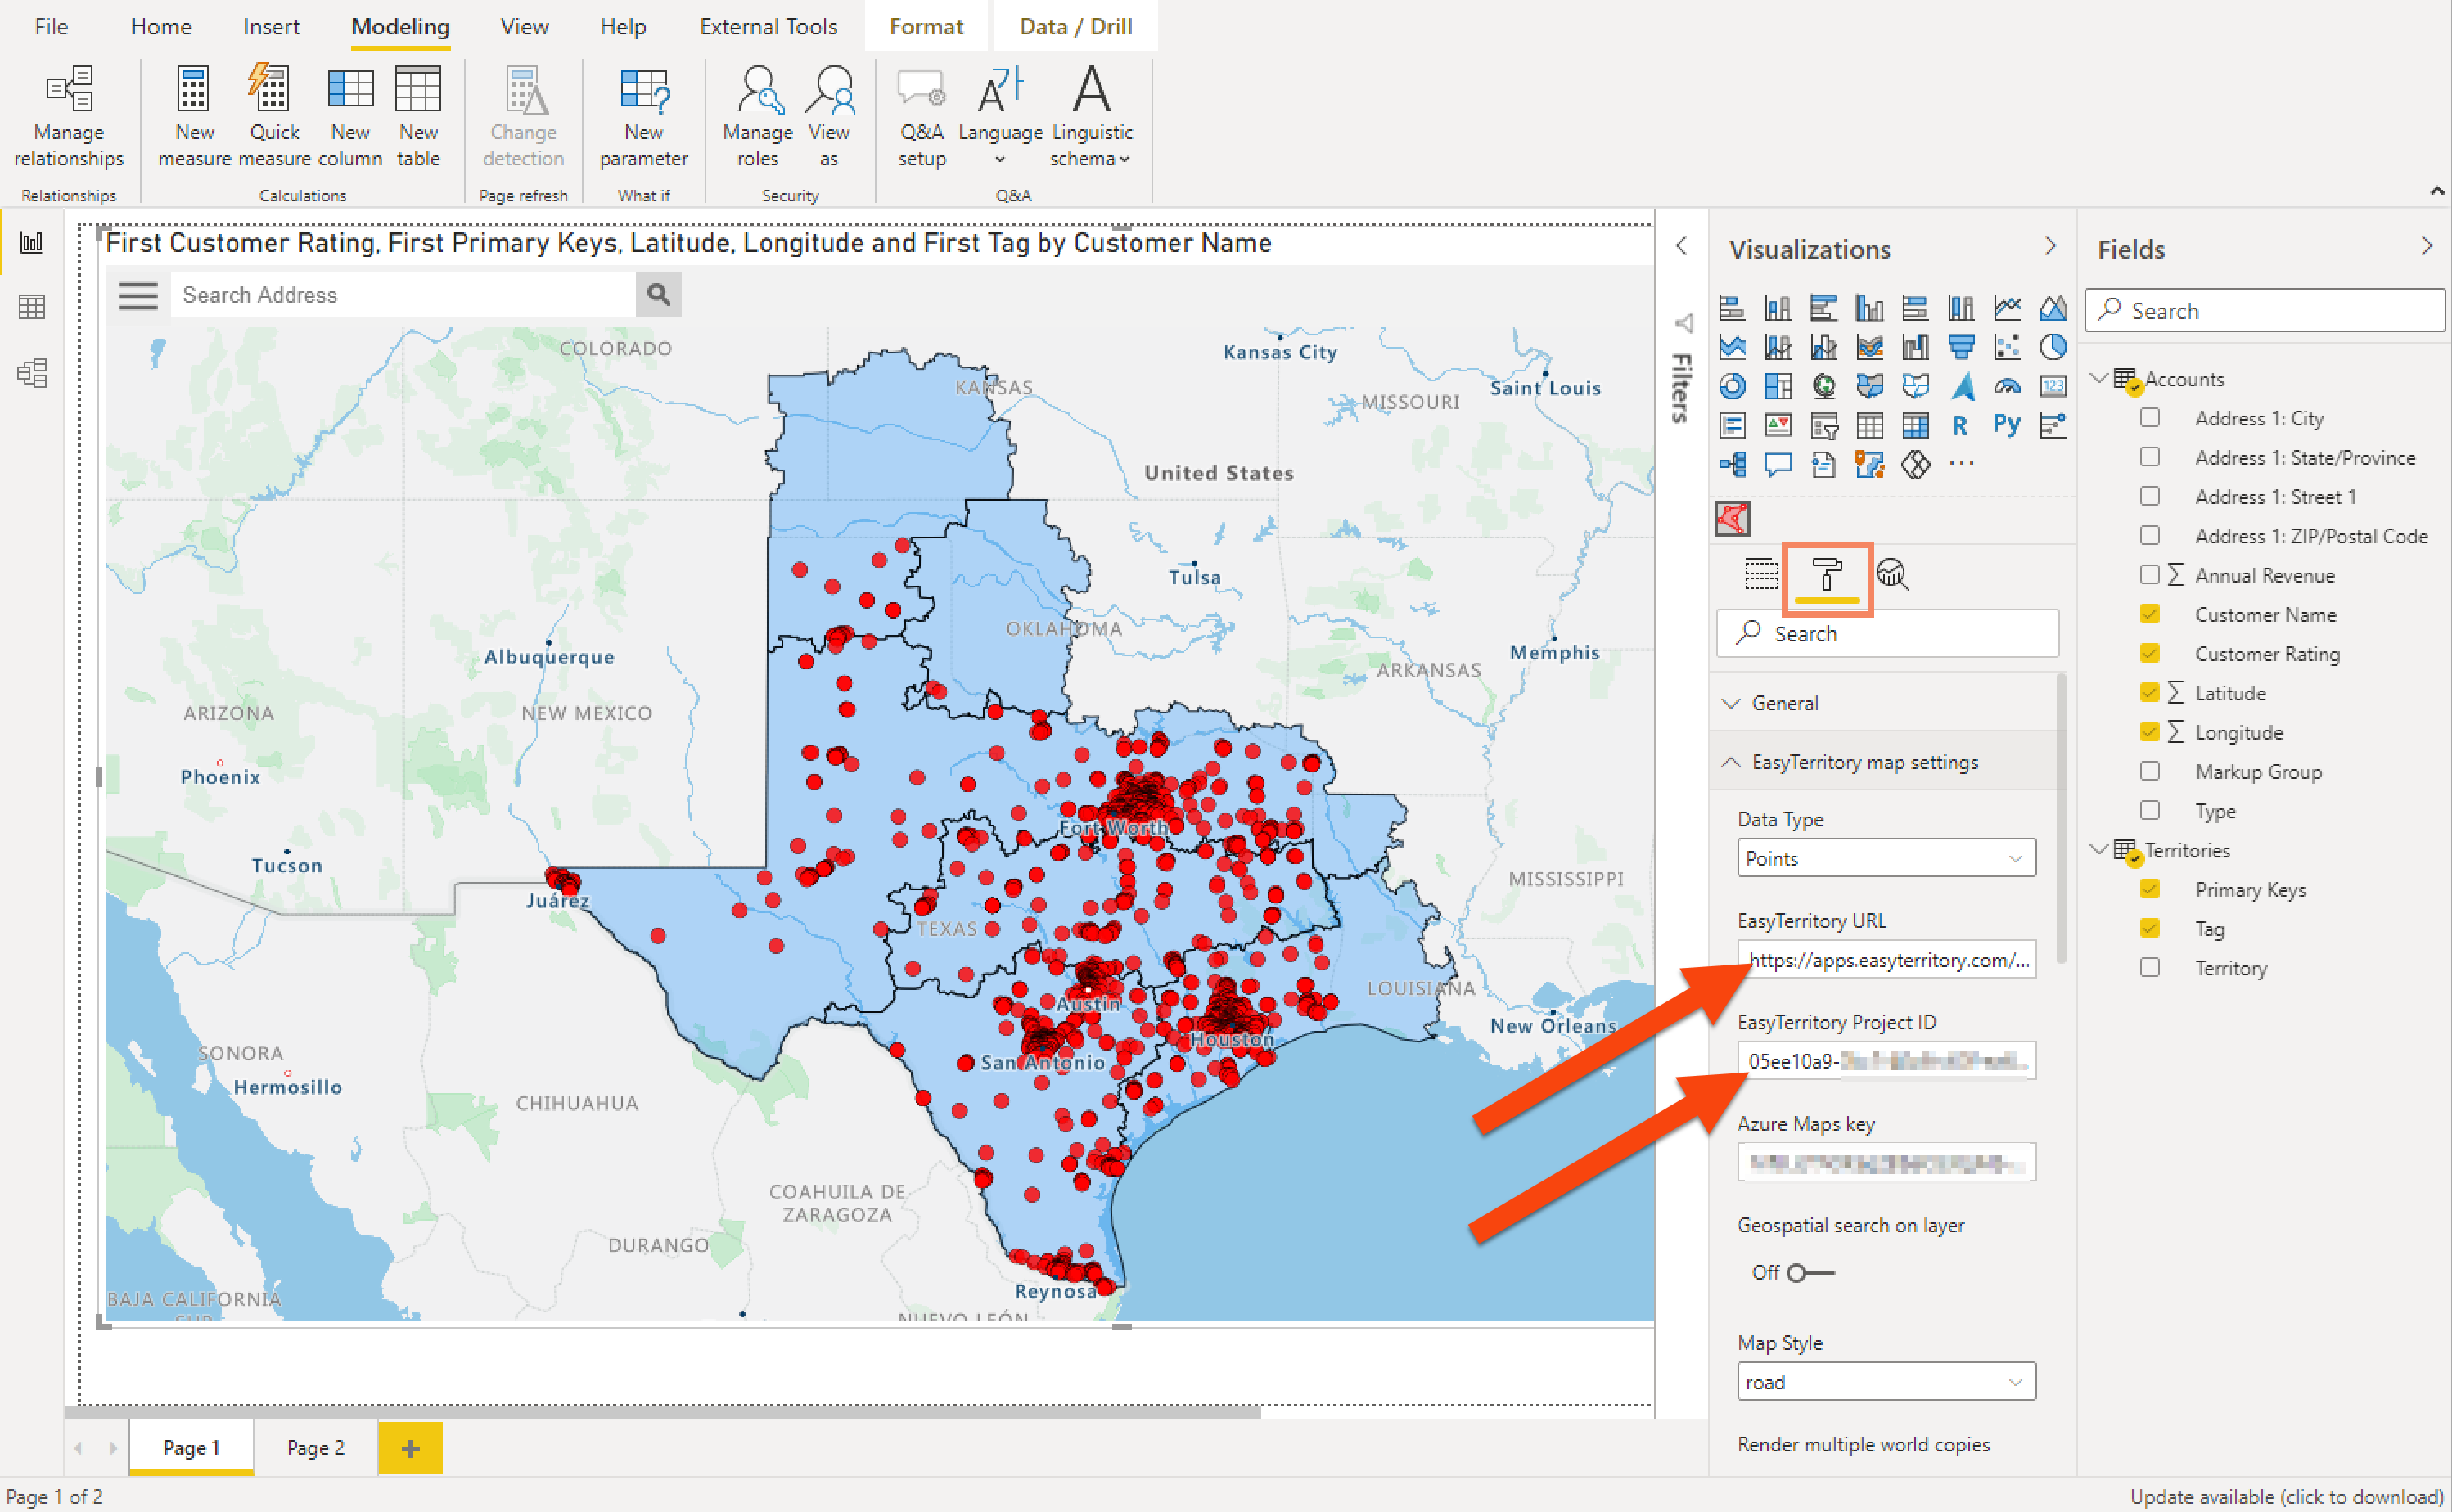
This documentation is divided into two sections. First, directions to configure the EasyTerritory Territory Visual with points. Secondly, to add territories with your displayed points.

Configure EasyTerritory Territory Visual

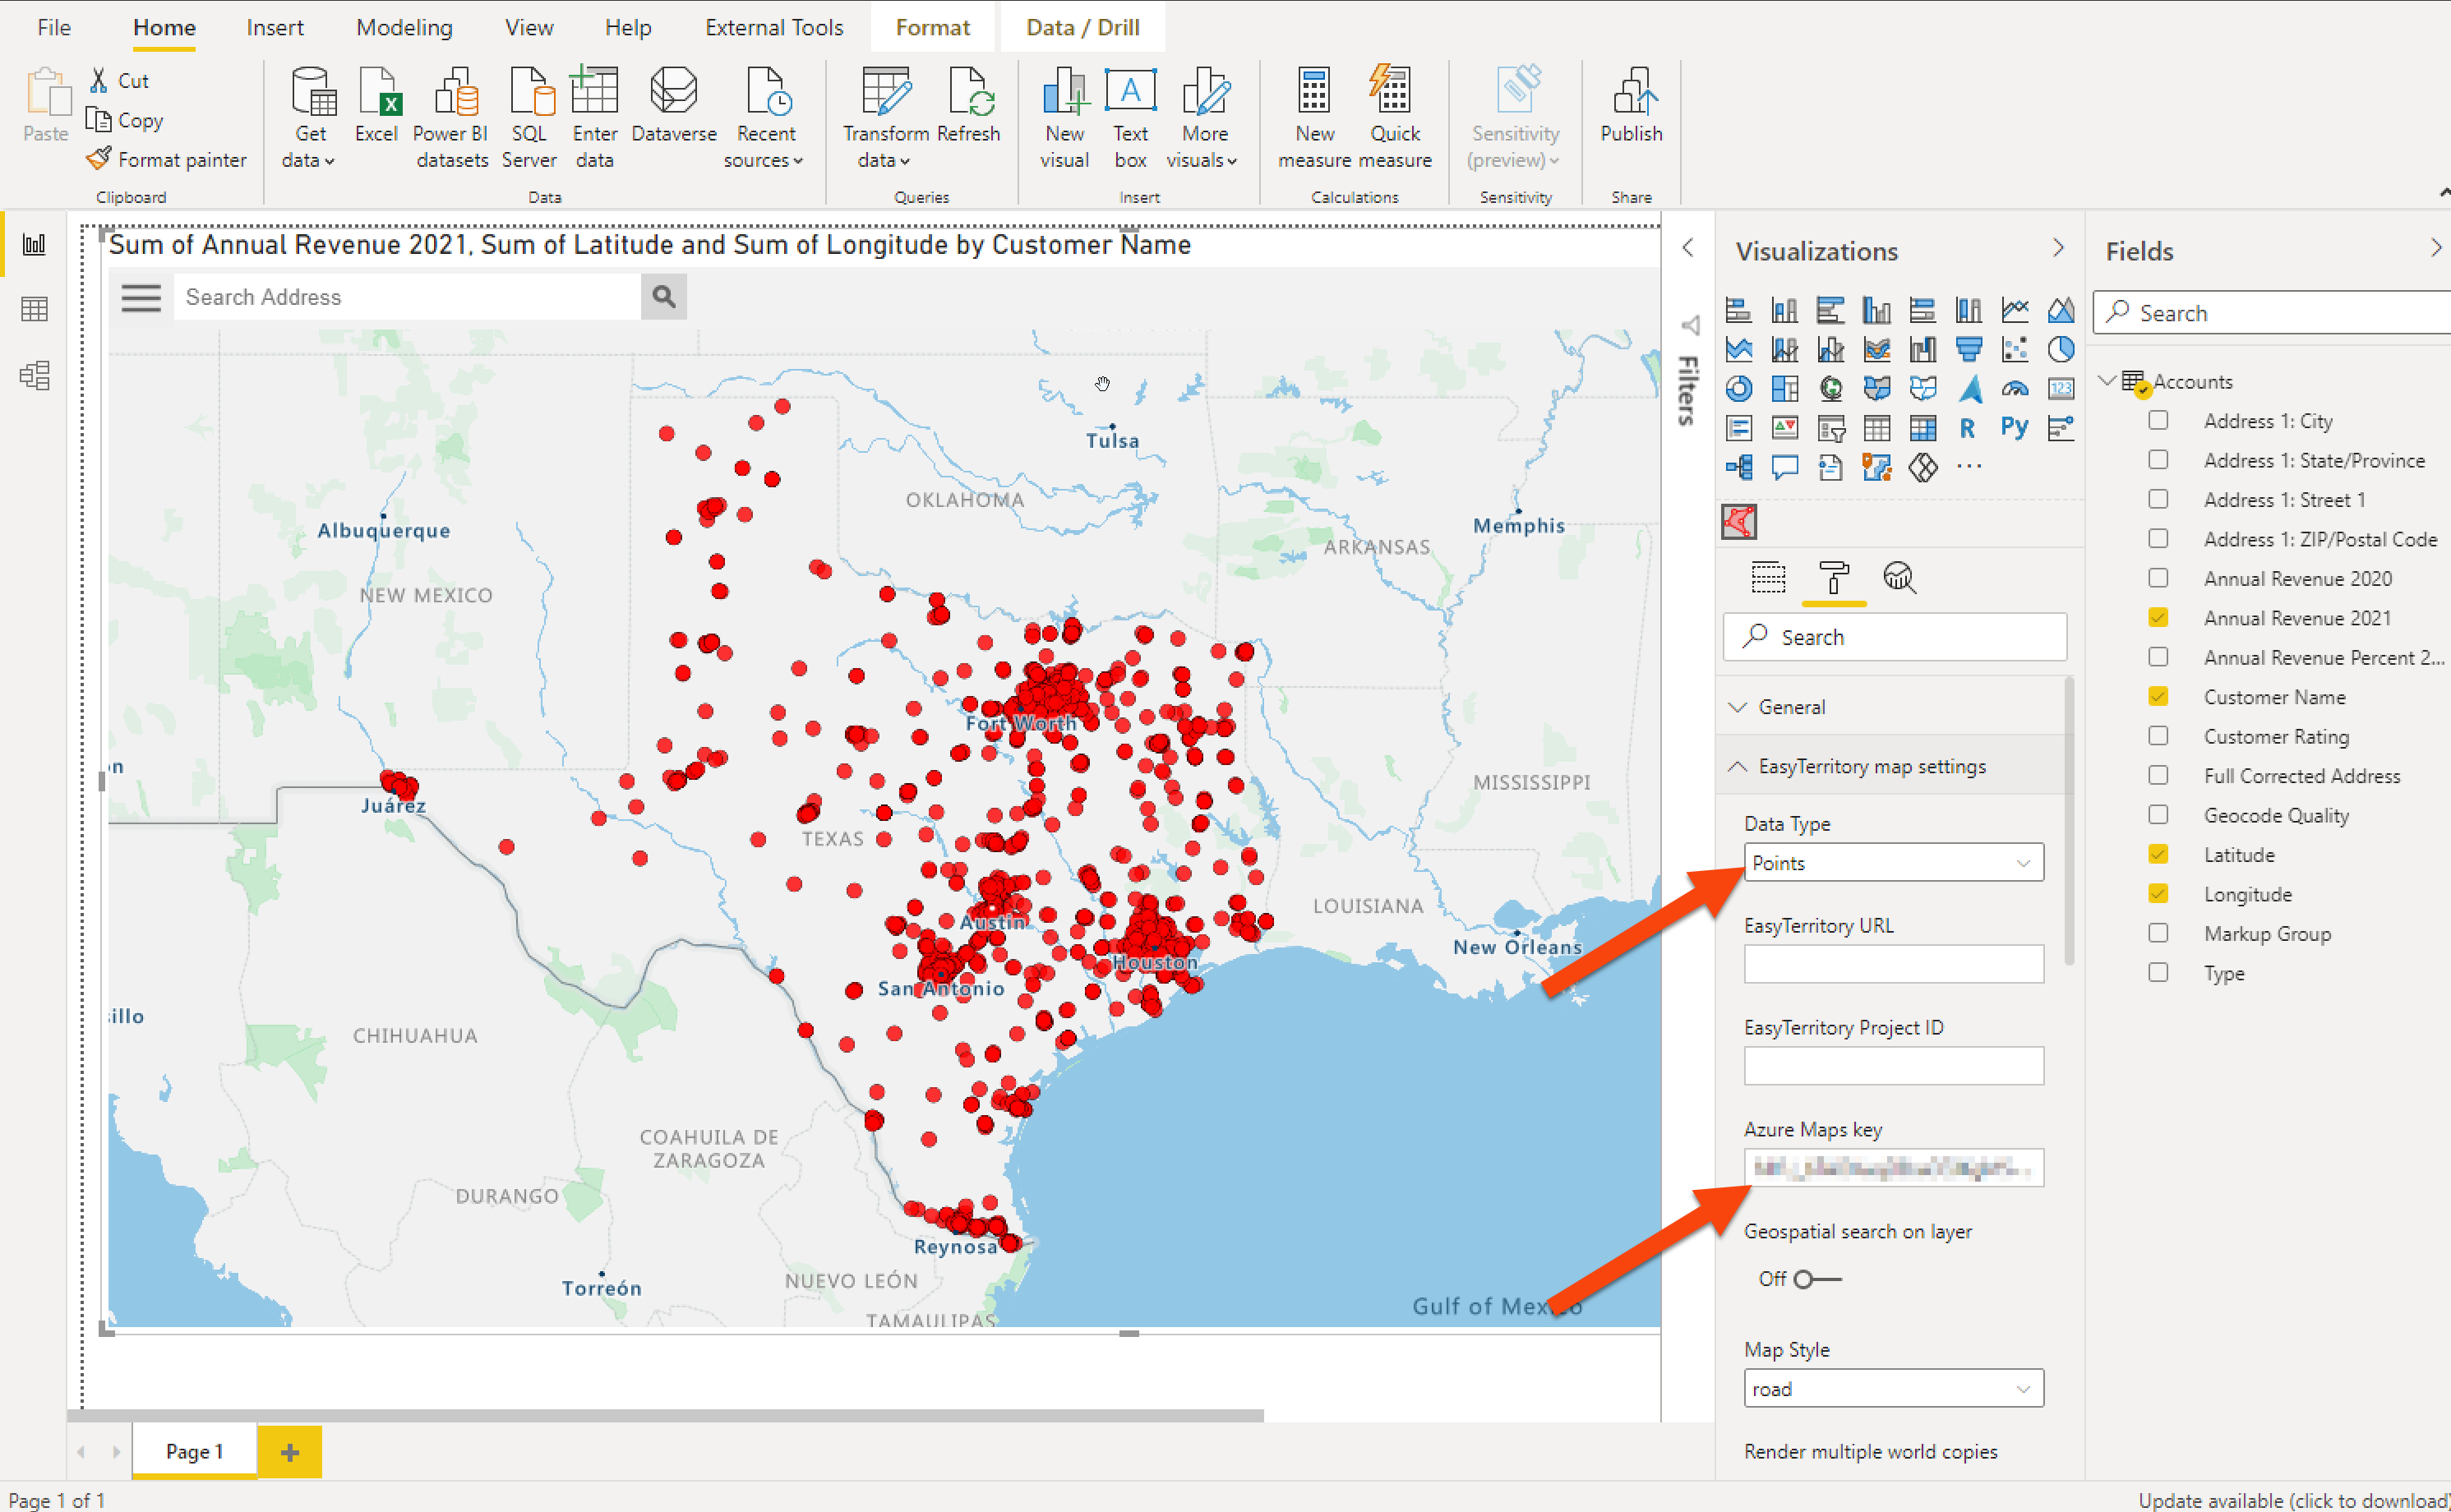
Create and populate required visual fields to display points in a Power BI report.

  • Step 1. Add the Territory Visual to your report clicking “Get more visuals” in Power BI desktop and searching for EasyTerritory. Once the EasyTerritory Territory visual is added to your Power BI report, the next step is to configure the fields.
  • Step 2. Select the visual and under the ‘Fields’ panel add required fields:
    • Name Column – Name of your territories that will be used to group your data. This can optionally be a hierarchy.
    • Classification Column – a number or text field that will be used to determine the desired classification grouping.
    • Latitude, Longitude – latitude and longitude values of your points.
  • Step 3: Under the ‘Format’ panel add fields:
    • Data Type – (required) ‘Territories’ or ‘Points’. In this case of loading accounts, select ‘Points’.
    • Azure Maps key (Optional) – Enter your Azure Maps key.  If you have an EasyTerritory Web Application subscription, the Azure Maps key is obtained from EasyTerritory by entering the EasyTerritory URL.
    • EasyTerritory URL – Enter your EasyTerritory Instance URL for loading territories: https://apps.easyterritory.com/{GUID}/{Site}  IMPORTANT NOTE: In order to get an EasyTerritory Web Application trial, you need to register here.
    • Project ID – (optional) Enter your EasyTerritory project ID for loading territories.

OPTIONAL: Create and populate required visual fields to display territories with points in a Power BI report.

  • Step 1: Create territories in the EasyTerritory web application. In order to get an EasyTerritory subscription, you need to register here.
  • Step 2: Build territory polygons in the EasyTerritory web applicaiton following these steps.
  • Step 3: Load territories into your Power BI data model using the EasyTerritory Power BI Connector.
  • Step 4: Create a relationship with point data and territory data.
  • Step 5: Select the visual and under the ‘Fields’ panel add required fields from your ‘Territories’ table:
    • Primary Keys – Text field from EasyTerritory Power BI custom connector that maps the ‘Related Territory Name Column’ to territory geometry stored in EasyTerritory Enterprise. This needs to always be ‘Primary Keys’ from your territory table added to your data model via the EasyTerritory data connector.
    • Related Territory Name Column – Text field from territory table that contains the name of your territory.
  • Step 5: Under the ‘Format’ panel enter required fields from your EasyTerritory instance:
    • EasyTerritory URL – (required) Enter your EasyTerritory Instance URL : https://apps.easyterritory.com/{GUID}/{Site}
    • Project ID – (required) Enter your EasyTerritory project ID.