Overview
In order to display territories, the Territory Visual requires access to the EasyTerritory web application to build your territory polygons. To obtain trial access to the EasyTerritory web application, please register here.
This documentation is divided into three sections.
Building Territory Polygons in the EasyTerritory Web Application
The EasyTerritory web application is used to create your territory polygons from a variety of geography types included ZIP Code (Postal Code), County, State, or Country Boundaries. The end result is a single polygon for each territory that can be used to create heat maps or drill-through reports.
- Step 1: In EasyTerritory web application, build your territories following the steps in this video.
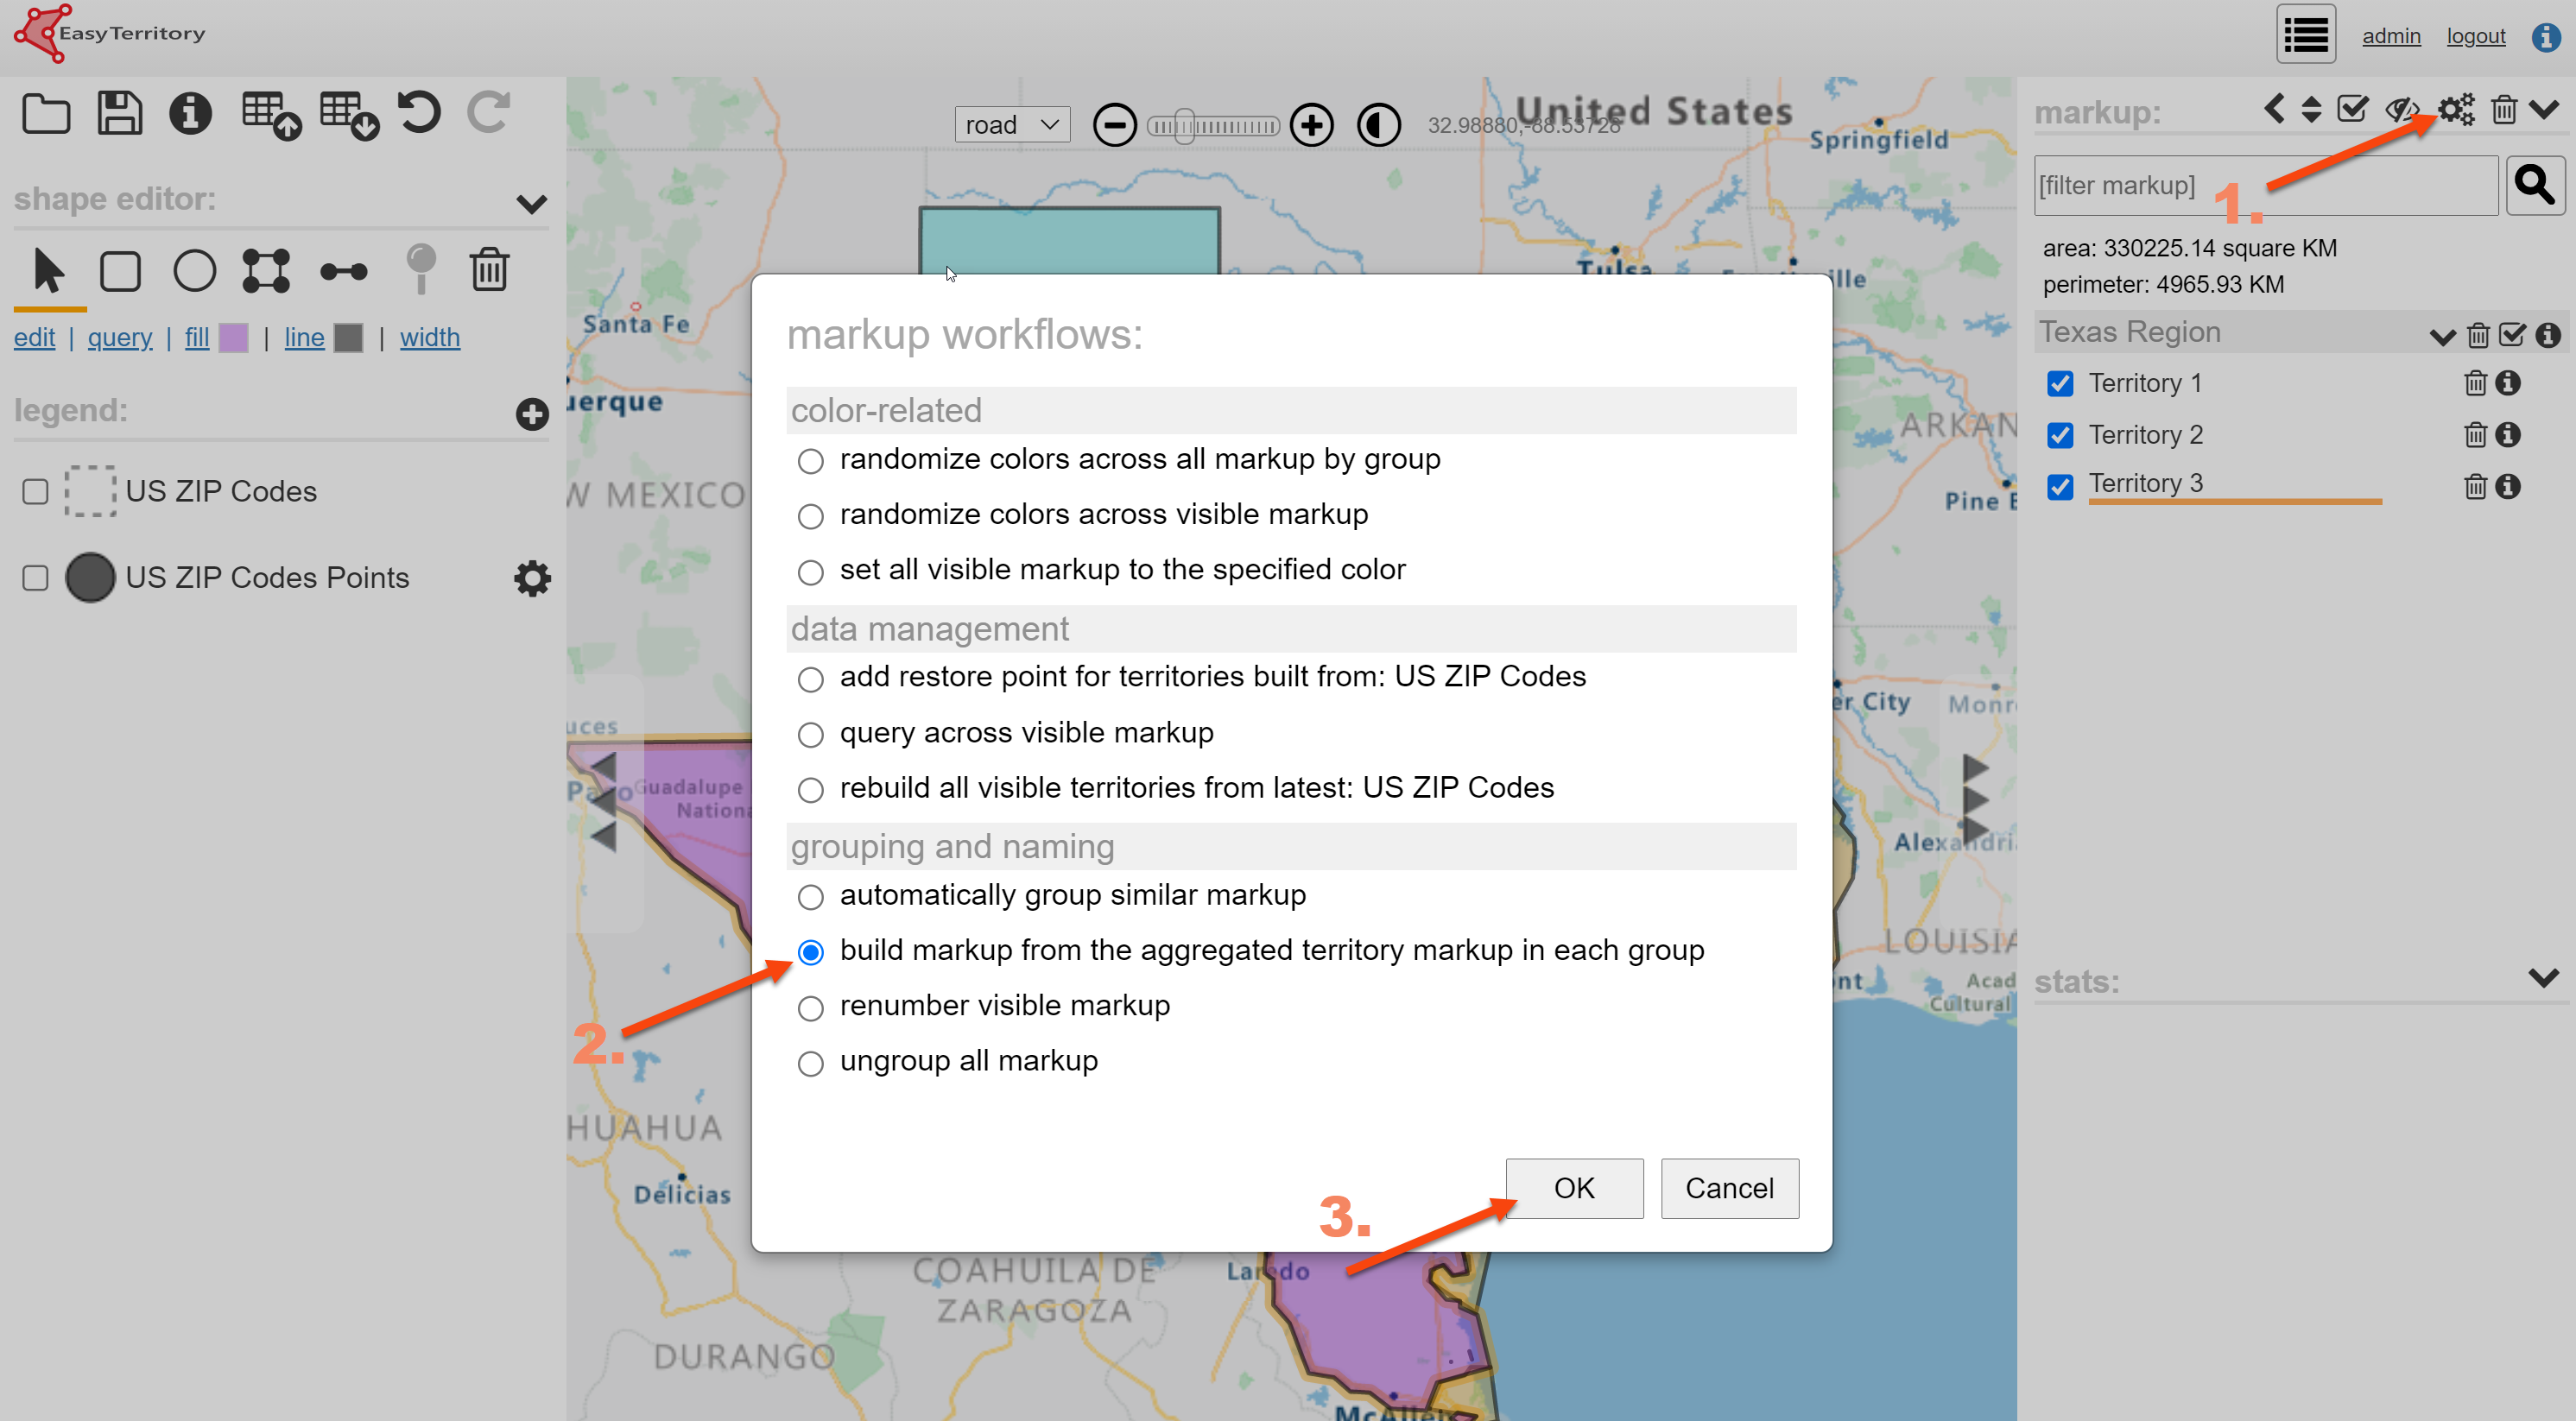
- Step 2: If you have a ‘Group’ configured in your EasyTerritory project, you can build group-level polygons for a drill-down in the Territory Visual.
- Optional: To include parts in your hierarchy, build or re-build your territories with the point layer from the EasyTerritory catalog included in your project.
- Required: To build the group territory geometry run the below workflow.
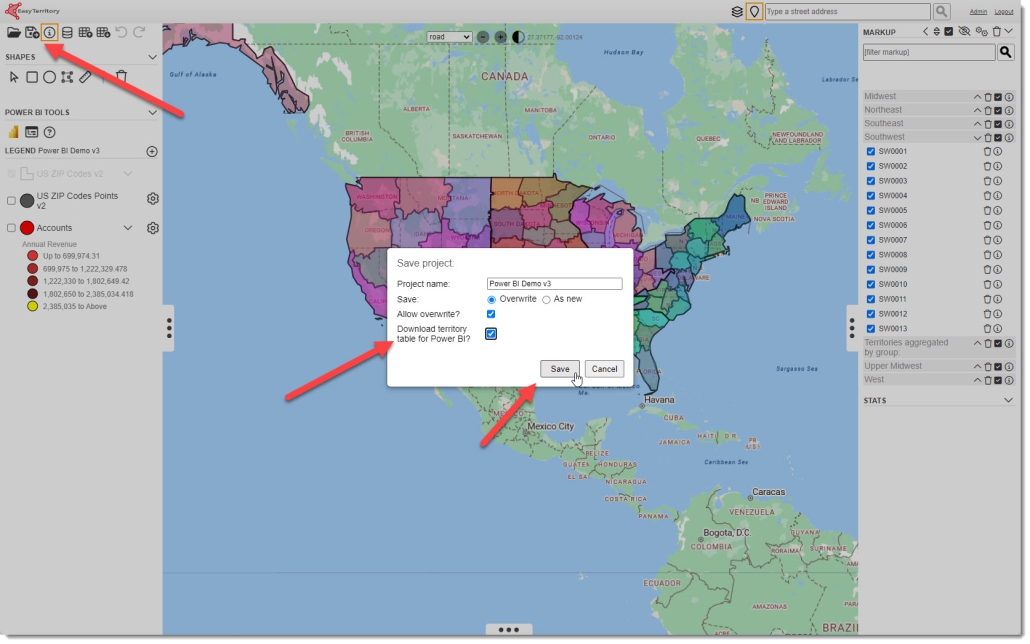
- Step 3: Save Project and “Publish for Power BI”
- Step 4: (Optional) Use ‘EZT Heirarchy.csv’ in your data model and skip to the last section Configuring Territory Visual in Power BI.
- The ‘EZT Heirarchy.csv’ file provides a quick way to get started with the Territory Visual in Power BI. If you’re planning to publish to Power BI Service you will need to configure a personal gateway. The better approach will be to use the EasyTerritory Data Connector for Power BI described in the next section.
Load Territory Table into PBI Data model using the EasyTerritory Data Connector
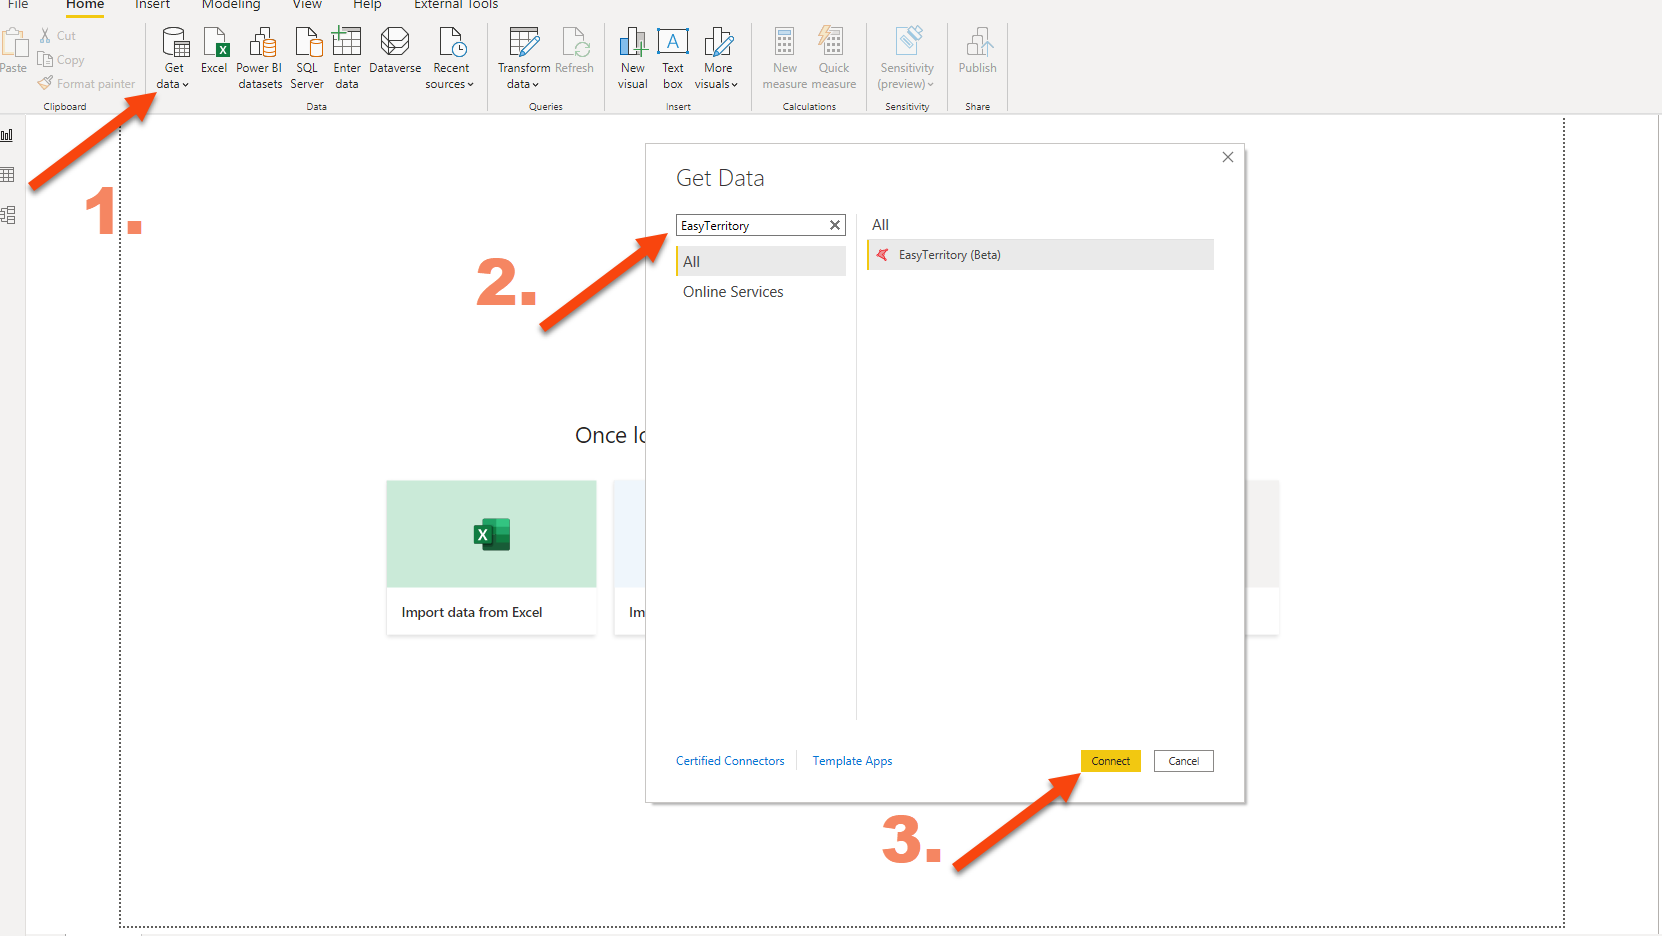
Use the EasyTerritory Power BI Connector to load territory data into Power BI.
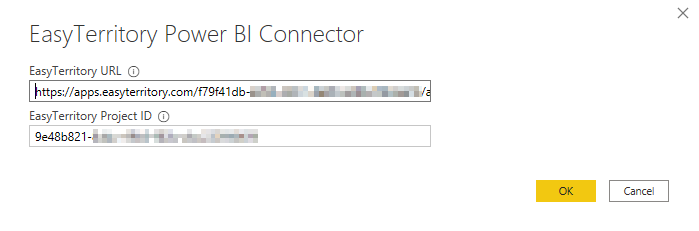
- Step 3: Configure the EasyTerritory Connector.
- Enter your EasyTerritory URL, project ID and your service username and password
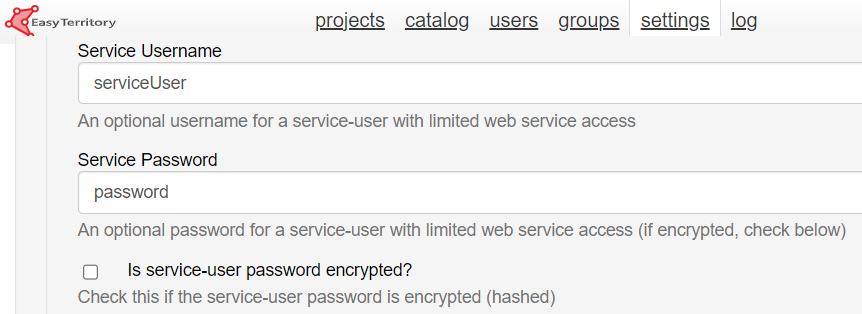
- Create a service user in EasyTerritory Admin PanelTo create a service user, sign in with an admin login. Go to the admin settings and under ‘Application Settings’ find the ‘Service User’ and ‘Service Password’ input fields. Enter desired credentials and click ‘Save’. Service user passwords are stored encrypted but if you would like additional security contact EasyTerritory support to store your service user encrypted password as hashed.
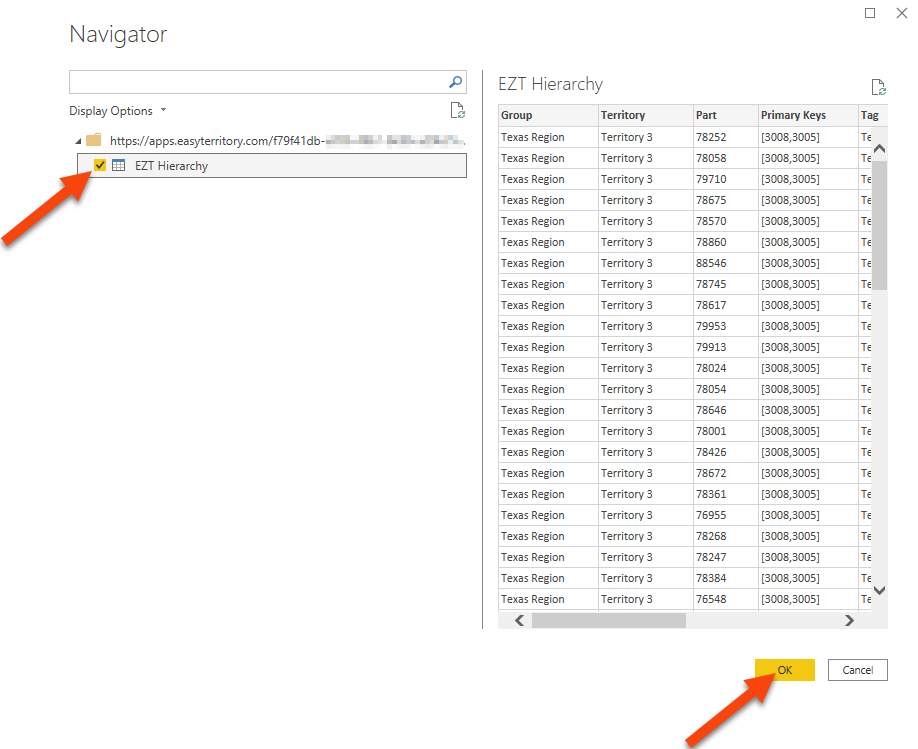
- Step 4: Select ‘EZT Hierarchy’, confirm there are no errors, and load into Power BI report.
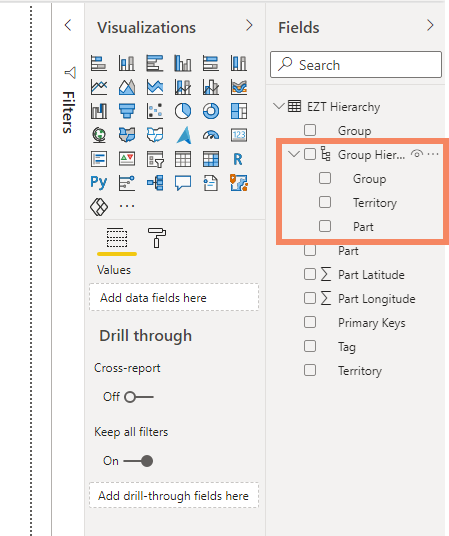
- Step 5: Optional: Create a hierarchy based on territory grouping from EasyTerritory project.
Create and populate required visual fields to display territories in a Power BI report.
- Step 1: Under the Visualizations tab in your Power BI report click the three dot ellipse and select ‘Get more visuals’.
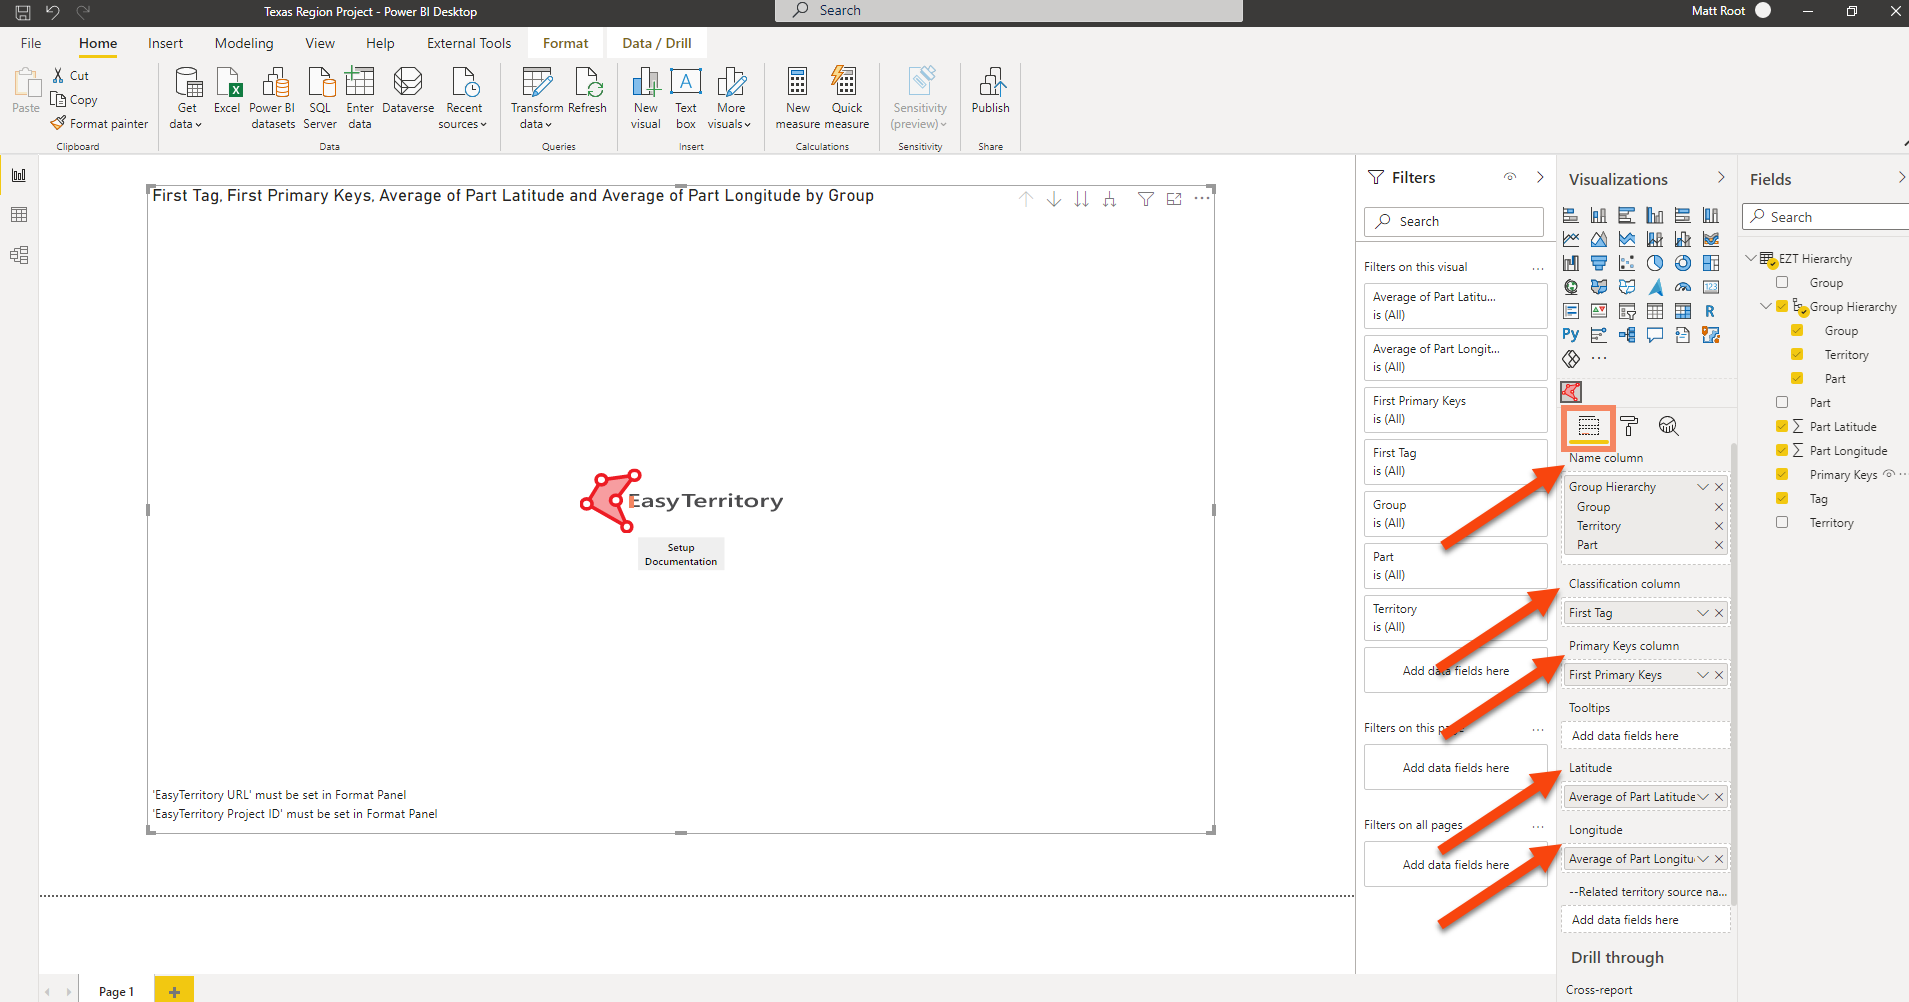
Step 2: Select the visual and under the ‘Fields’ panel add required fields:
- Name Column – Name of your territories that will be used to group your data. This can be a hierarchy.
- Classification Column – A number or text field that will be used to determine the desired classification grouping.
- Primary Keys – Text field from EasyTerritory Power BI custom connector that maps the ‘Name Column’ to territory geometry. This needs to always be ‘Primary Keys’ from your data model.
- Latitude, Longitude – If you have a hierarchy and desire to load territory parts, add to these ‘Part Latitude’ and ‘Part Longitude’ respectively.
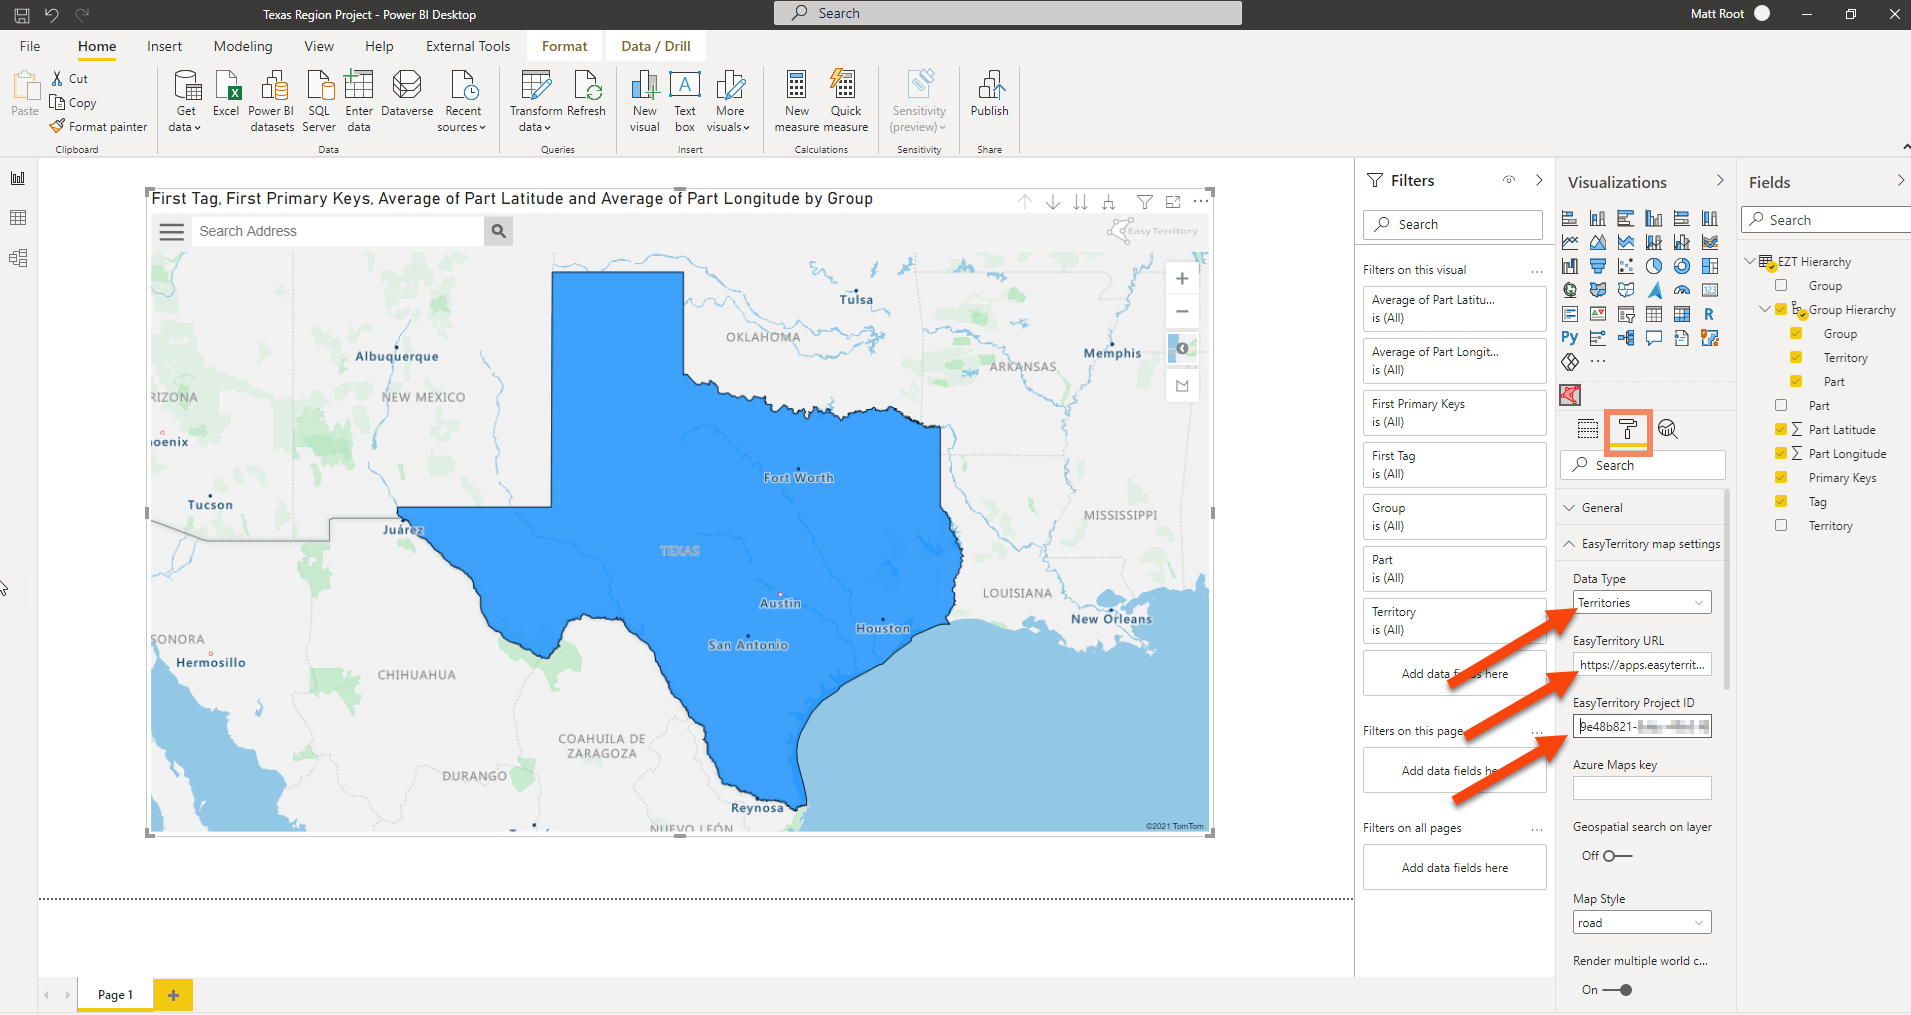
- Step 3: Under the ‘Format’ panel add fields:
- Data Type – (required) ‘Territories’ or ‘Points’. In this case of loading a territory hierarchy, select ‘Territories’.
- EasyTerritory Enterprise URL – (required) Enter your EasyTerritory Enterprise Instance URL : https://apps.easyterritory.com/{GUID}/{Site}
- Project ID – (required) Enter your EasyTerritory project ID.
- Azure Maps key – (optional) Enter your Azure Maps key.
If you need any assistance, want to give suggestions, or overall feedback, please email us at support@easyterritory.com