Capacity Planning (CP) estimates the necessary manpower (workload) for a given region based on historical records (e.g. completed work orders.) With the capacity planning tool, you determine if you have too many or too few reps or service-techs in a territory. The estimated workload is broken down by service date and the results are displayed in the statistics panel which provides additional information such as mean and standard-deviation and allows for exporting to Excel. Multiple factors are considered in this analysis:
- How is workload trending over time?
- How much dwell time is spent on-site?
- What is the driving distance between sites?
- How many hours per day are you targeting for your resources?
In order to use EasyTerritory’s capacity planning feature, there are two required data-columns which must be included in your dataset and flagged with the appropriate metadata:
- Visit Date – this is the date a rep visited a customer or a service-tech performed a break/fix. The data column must be flagged with partitionid
- On-site time in hours – this specifies the amount of dwell time per visit for a given site in hours. The data column must be flagged with routestopdelayhours.
To use EasyTerritory Capacity Planning, perform the following steps:
-
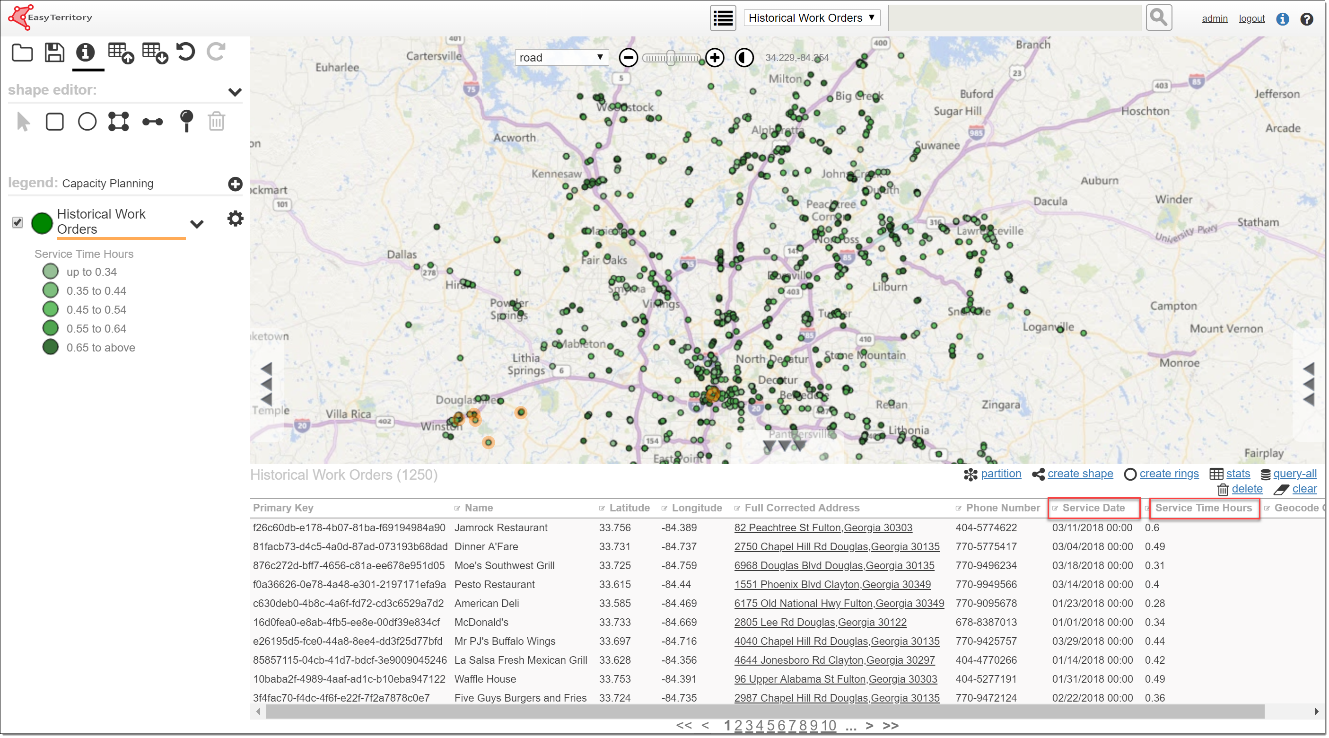
- Query the features you want to analyze. This may be done using any of EasyTerritory’s powerful querying capabilities (by ctrl-clicking on features; selecting by lasso, envelope or polygon).
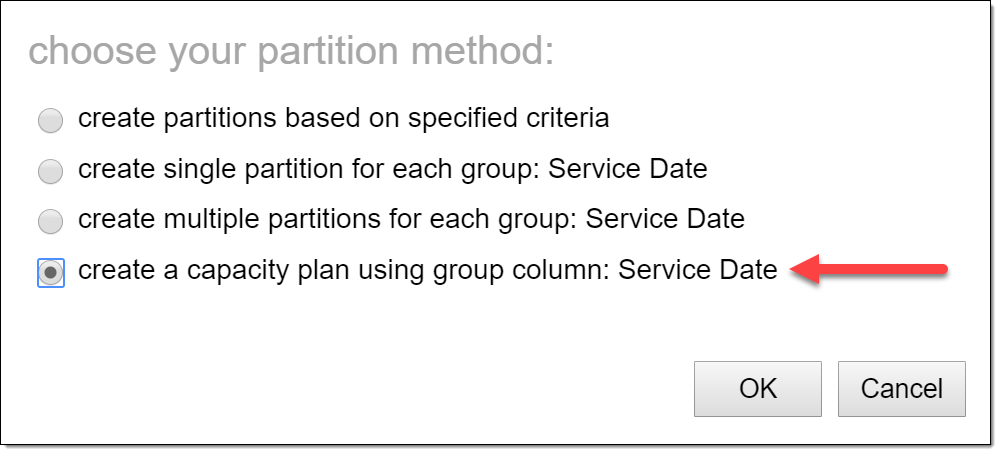
- Click on the partition link in the results-grid – this will open an options dialog:
-
- Select the create a capacity plan option – this opens the scheduling dialog:
-
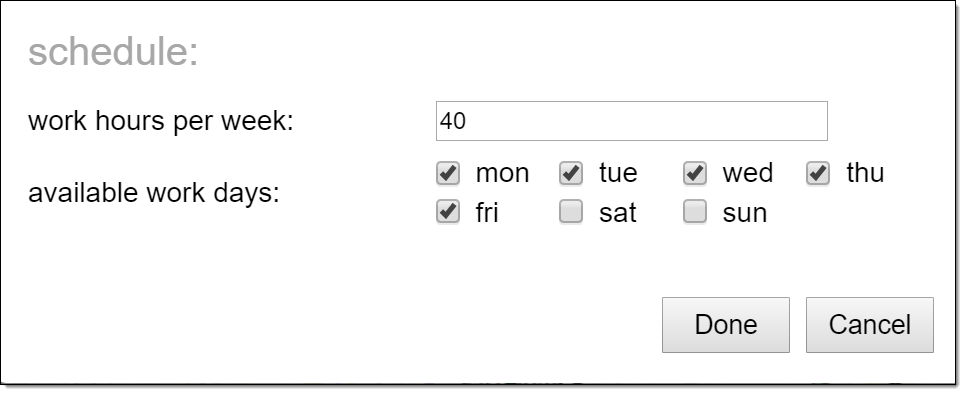
- Enter your scheduling criteria:
- Work hours per week – this is the target number of hours you want each resource to work per week.
- Available work days – these are the acceptable days to schedule work on
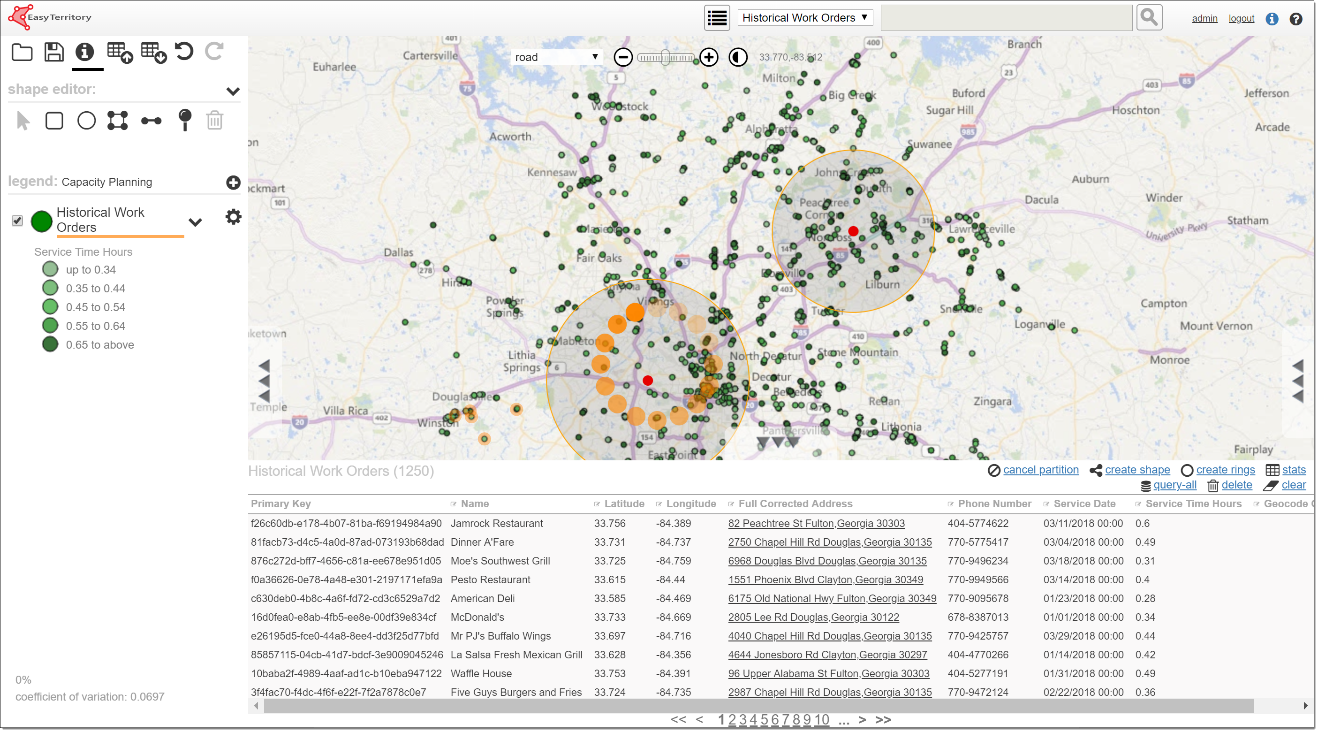
- Pressing “Done” will launch the CP process which can take minutes to hours to run depending on the scope of the analysis and the number of past days to consider. Each unique service day in the work order data is analyzed from oldest to most recent. On each day, the analysis will determine an optimal number of resources and assign an optimal service route to create a total effort for each resource. Once the day’s analysis is finished, the process moves to the next available day. The percentage complete in the lower-left is updated and the coefficient of variation shows how effectively the labor and driving time is distributed between the resources.
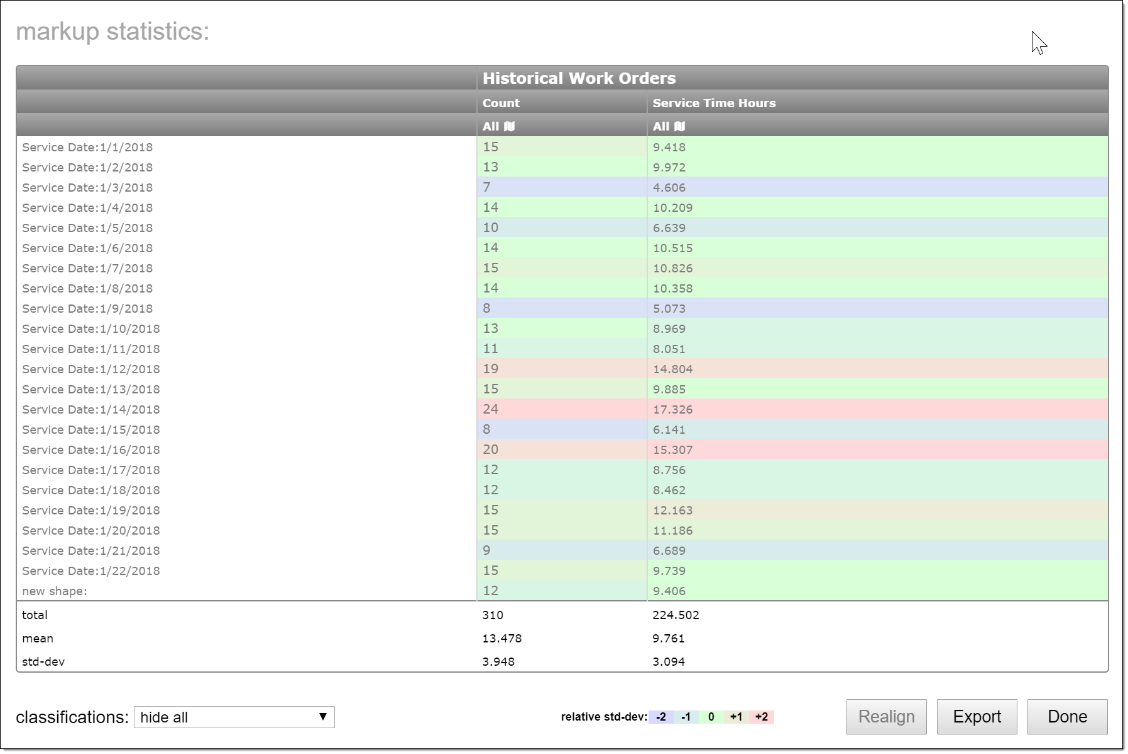
- The final results are presented in the statistics panel showing the total resource hours (service time and driving hours in this example) per service day optimized for driving time and workload distribution. A mean workload and standard deviation across the entire historical record is displayed at the bottom. From here you can export your analysis to a spreadsheet.