
In this article, you’ll learn how to troubleshoot issues concerning:
EasyTerritory Territory Visual
Issues importing the latest version of the EasyTerritory visual into Power BI Desktop.
Check to make sure you are on an updated version of Power BI desktop.
We recommend you are on the latest version of Power BI Desktop because you can run into compatibility issues with trying to import an updated version of the EasyTerritory visual on a previous versions of Power BI desktop
EasyTerritory visual version 4.1.0- must be on Power BI Desktop August release or later.
EasyTerritory visual version 4.0.56- must be on Power BI Desktop July release or later.
Not seeing field values (or seeing repeated values) from another table in tooltip.
If you are trying to display fields in the tooltip from a table other than the ‘EZT Hierarchy’ table, make sure have correctly configured the relationship between your related table and the ‘EZT Hierarchy’ table. To do this, go to Power BI toolbar and under ‘Modeling’, select ‘Manage relationships’. In the ‘Edit relationship’ dialog confirm that you have highlighted the correct related fields in both tables and selected the correct ‘cardinality’ for your specific use case. Most times you will need to set the ‘Cross filter directions‘ to ‘both’. Lastly, make sure the ‘Make relationship active’ checkbox is selected.
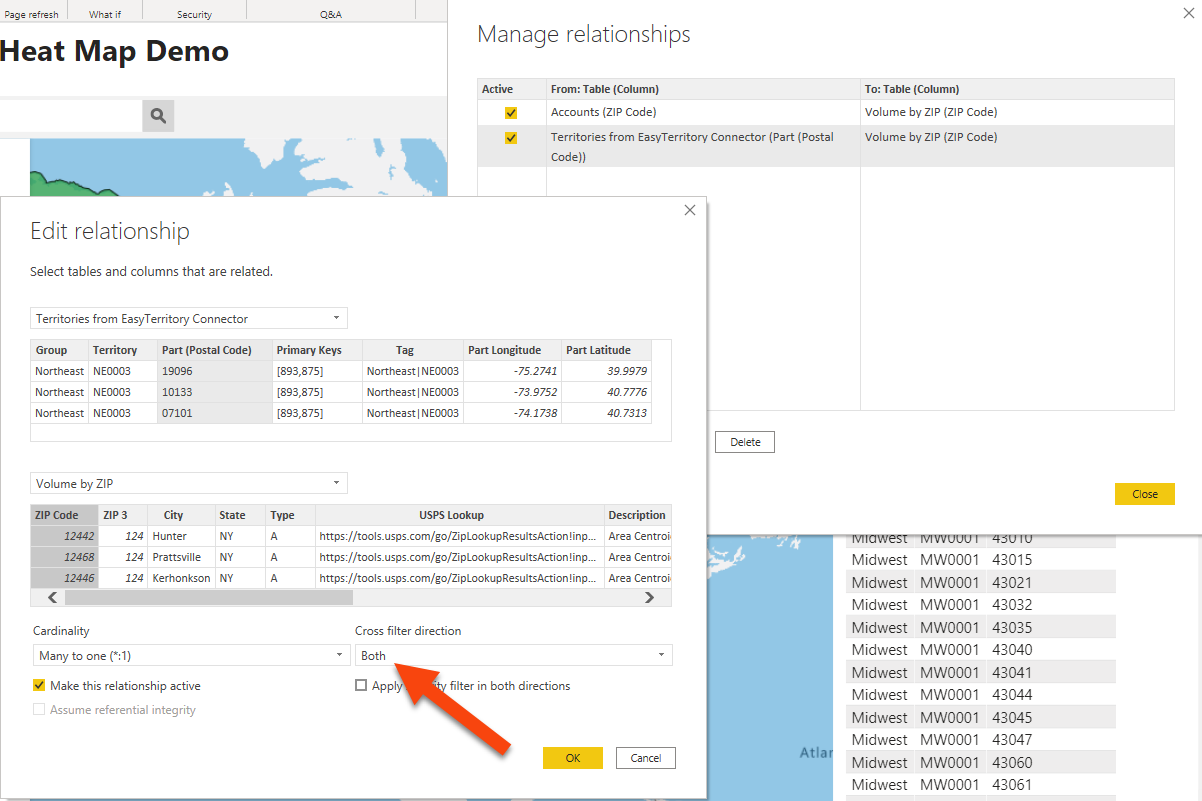
If you have done this and are not seeing the correct field value in the EasyTerritory visual tooltips it could be something concerning the type of modeling view that you have configured in Power BI desktop. We recommend, if possible, using the star schema design when building your data models with the ‘EZT Hierarchy’ table to avoid unexpected and hard to diagnose issues.
How do I make my record data the Part-level of my hierarchy.
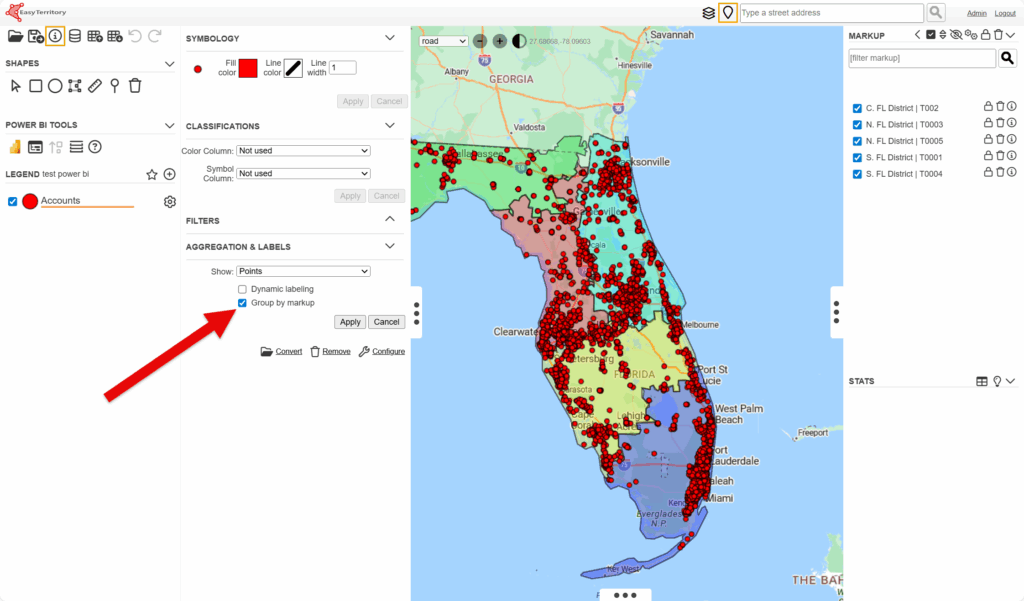
In the Layer Legend, next to your record data layer (e.g., “Accounts”), select the gear icon. Under Aggregation & Labels, enable Group by markup, then click Apply.
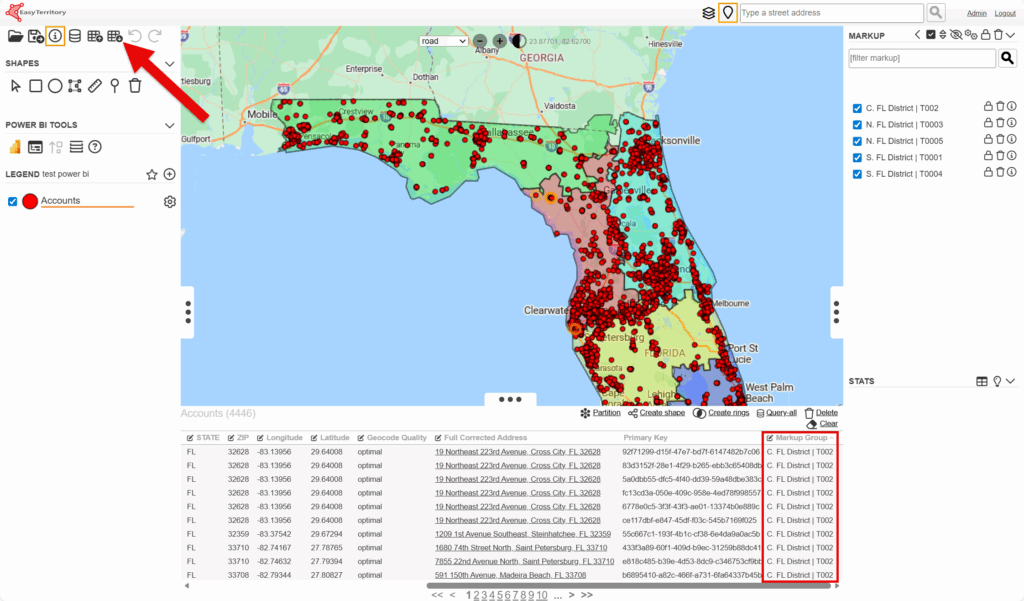
Query your record data. When the results appear in the data grid, click the Download icon in the top-left corner of the application and export the data grid results as a CSV file.
In Power BI query editor, import the record data csv that was previously exported from EasyTerritory alongside your EZT Hierarchy.csv file.
If your EZT Hierarchy includes part-level data, open the Power BI Query Editor and remove the following columns from your record data source:
- Part Longitude
- Part
- Part Latitude
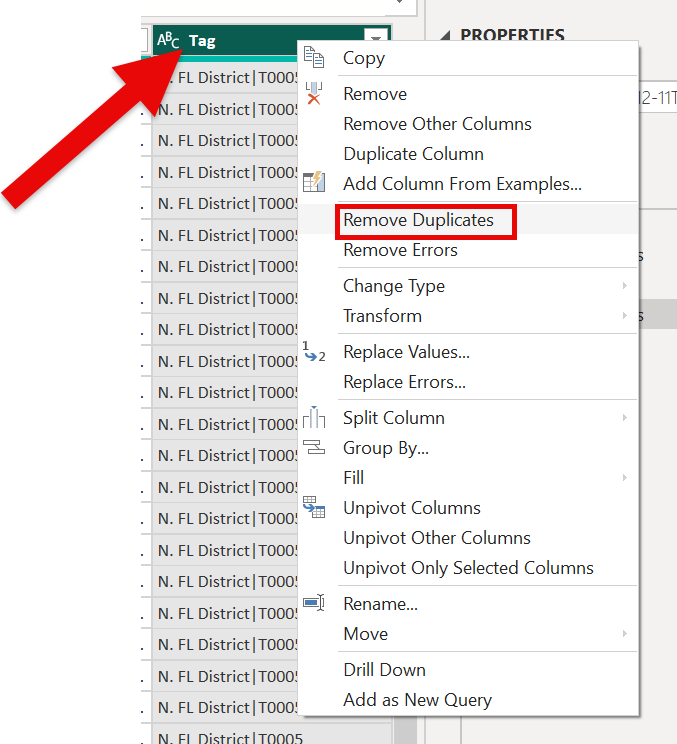
Select the EZT Hierarchy data source and right click the ‘Tag’ and select ‘Remove Duplicates’
In the Power Query Editor ribbon, select Merge Queries. In the Merge dialog, match the Tag column from the EZT Hierarchy table with the Markup Group column from your record table.
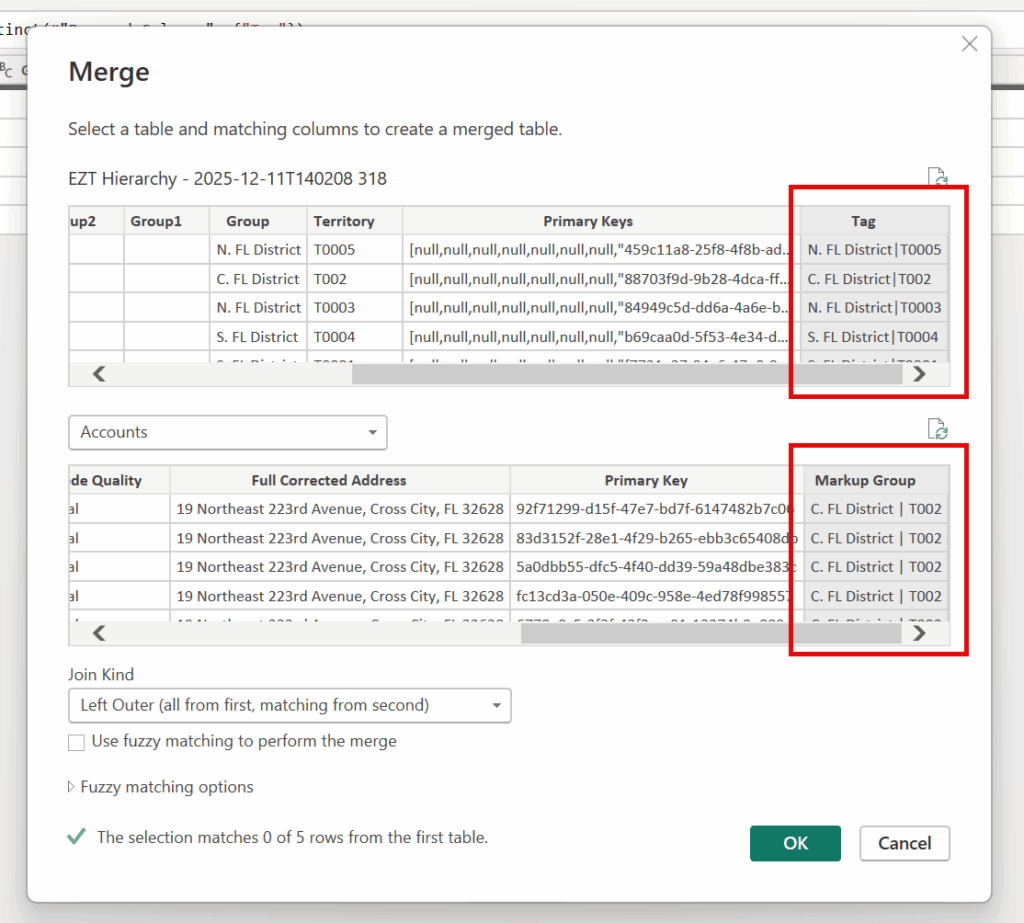
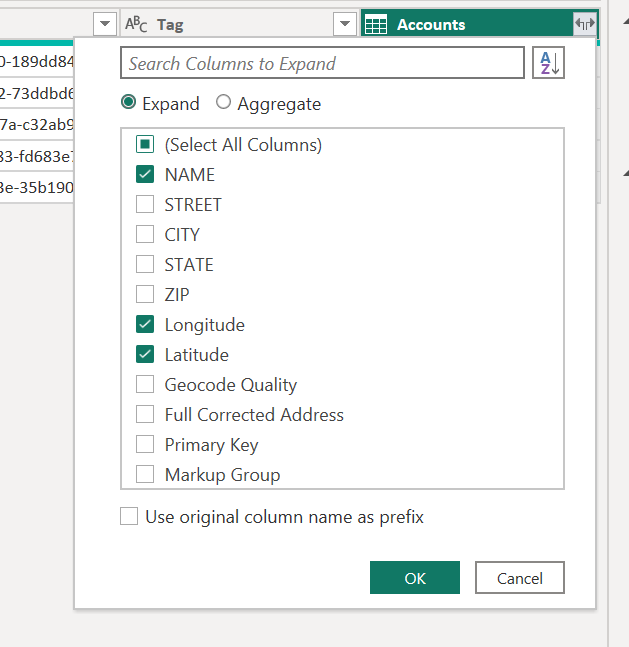
Finally, after merging the tables, expand the record column and select the unique identifier, latitude, and longitude columns from the record table. Optionally, you can include any additional columns.
EasyTerritory Power BI Connector
EasyTerritory Connector not showing as a data source in the ‘Get Data’ dialog within Power BI Desktop
Make sure you have correctly side-loaded the EasyTerritory Connector in Power BI Desktop.
To side-load the connector follow these instructions to create the path in your desired users folder that Power BI Desktop will pull from. This needs to be your default ‘Documents’ folder on your C drive, don’t create a new folder named ‘Documents’
[Documents]\Power BI Desktop\Custom Connectors
If the folder doesn’t exist, create it and drop the EasyTerritoryConnector.mez file in that location.
Further support:
If you need any assistance, want to give suggestions, or overall feedback, please email us at [email protected]