
Territory Visual for Power BI
Visualize and manage your territories inside Power BI — integrate boundary maps, realign zones, and gain spatial insight right within your dashboards.
The complete Power BI solution for smarter territory visualization
EasyTerritory + Power BI is not just an integration; it’s a comprehensive solution designed to elevate the way you manage and visualize your territory data. At the heart of this solution is the advanced EasyTerritory Enterprise platform, which offers robust tools for building, maintaining, and publishing your territory boundaries. These boundaries are seamlessly integrated into the Territory Visual, allowing for a unified experience in managing and analyzing territory data within Power BI. This enterprise-grade solution ensures that your territory data is always up-to-date, accurate, and ready to be utilized in powerful visualizations.
Who should use it?
The Territory Visual for Power BI is an indispensable tool for organizations looking to create dynamic executive dashboards, detailed sales management reports, and intuitive sales rep views. Whether you’re a business executive needing a high-level overview of territory performance, a sales manager tracking team progress, or a sales rep seeking detailed insights into your specific region, EasyTerritory equips you with the tools you need. The visual’s versatility allows you to build custom dashboards tailored to your specific needs, enabling you to visualize and measure critical metrics such as territory performance, proposed realignments, and coverage gaps. With EasyTerritory, you can quickly identify opportunities for growth, optimize your sales strategies, and make data-driven decisions with confidence.
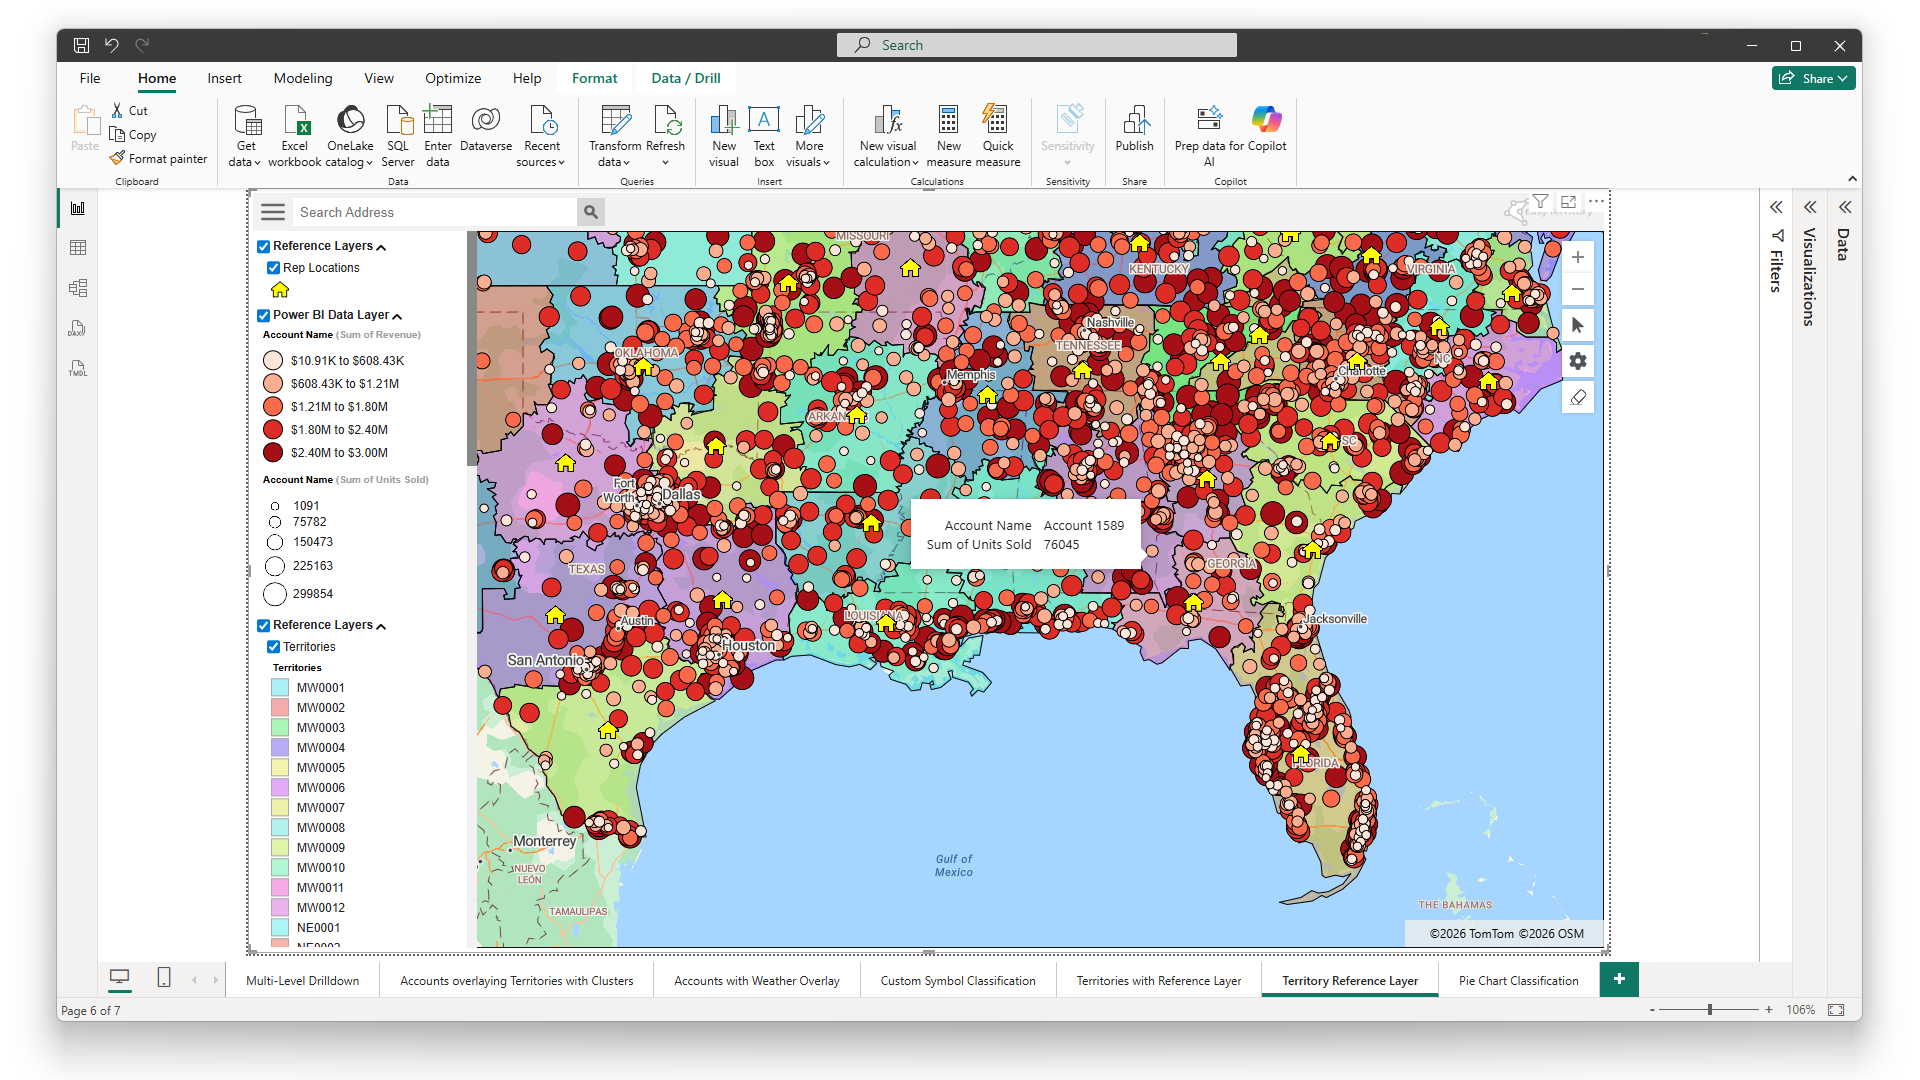
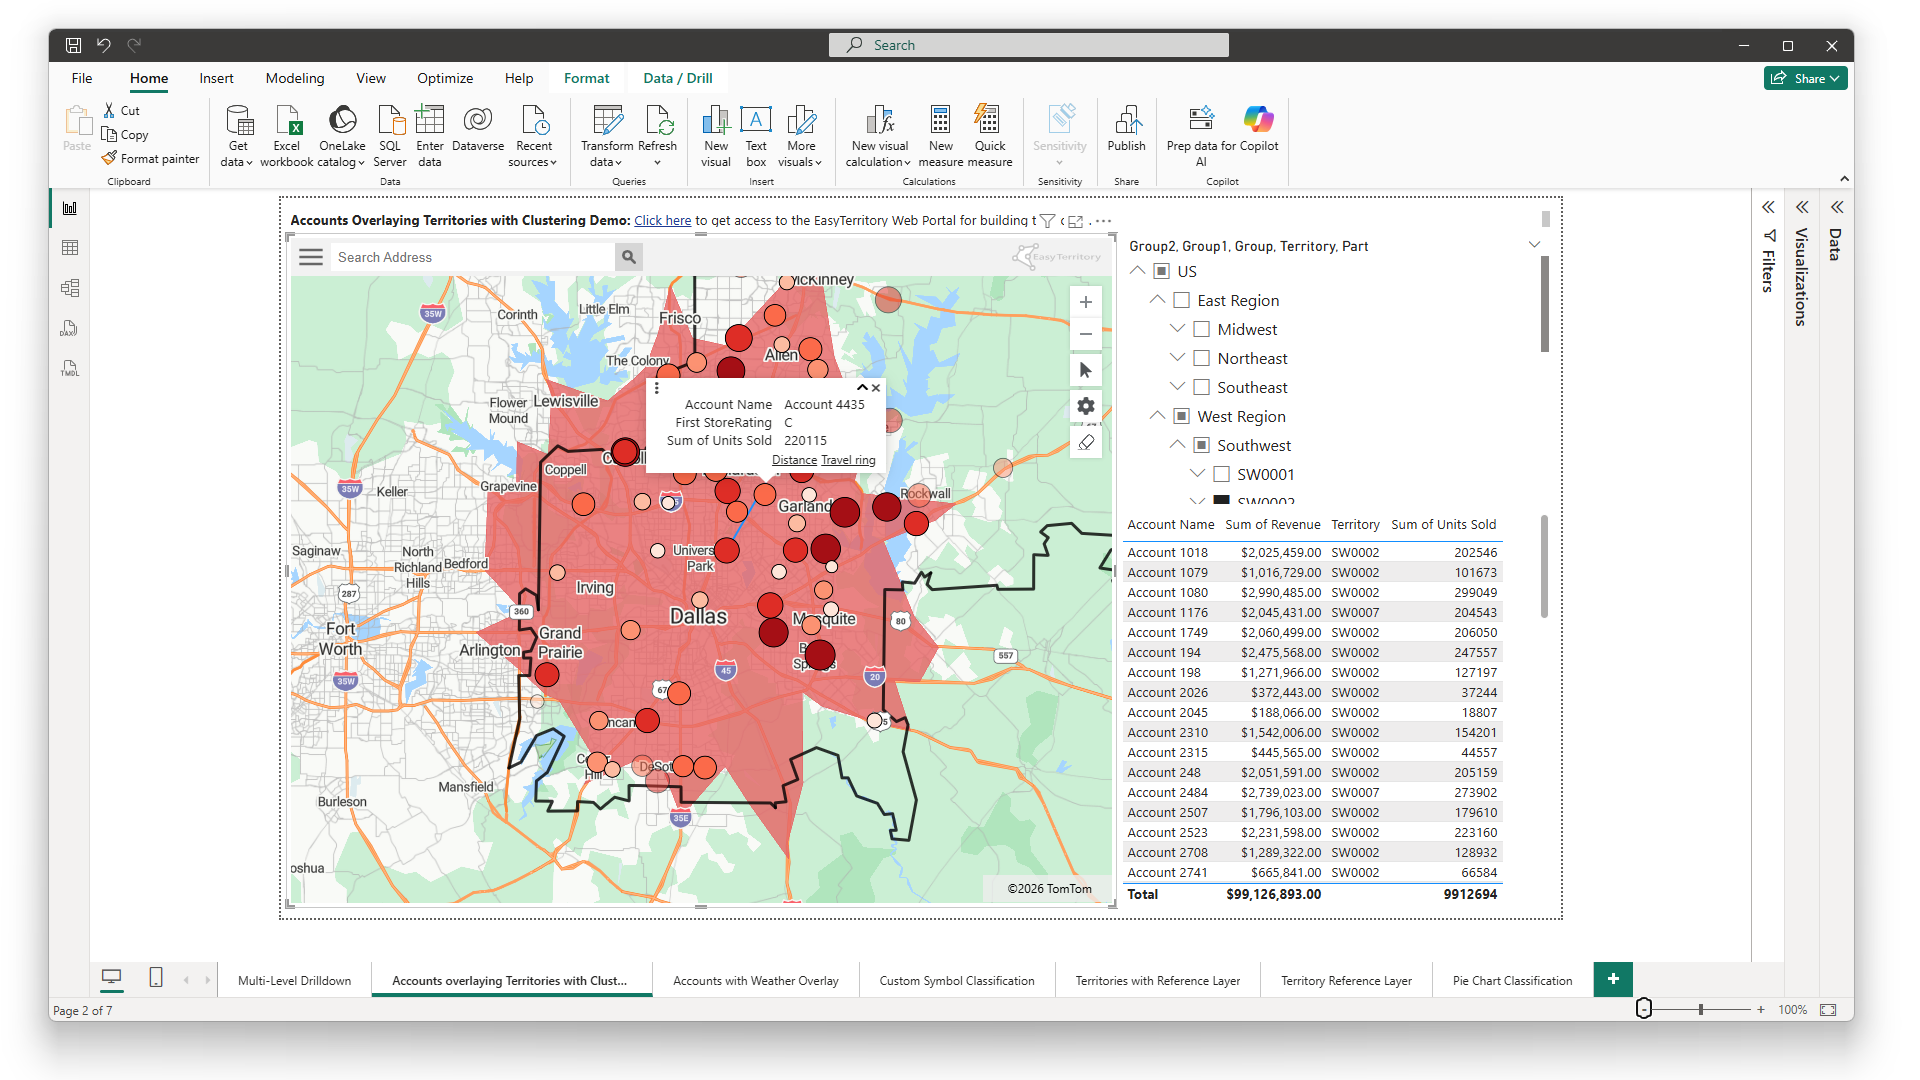
Territory Drill Down
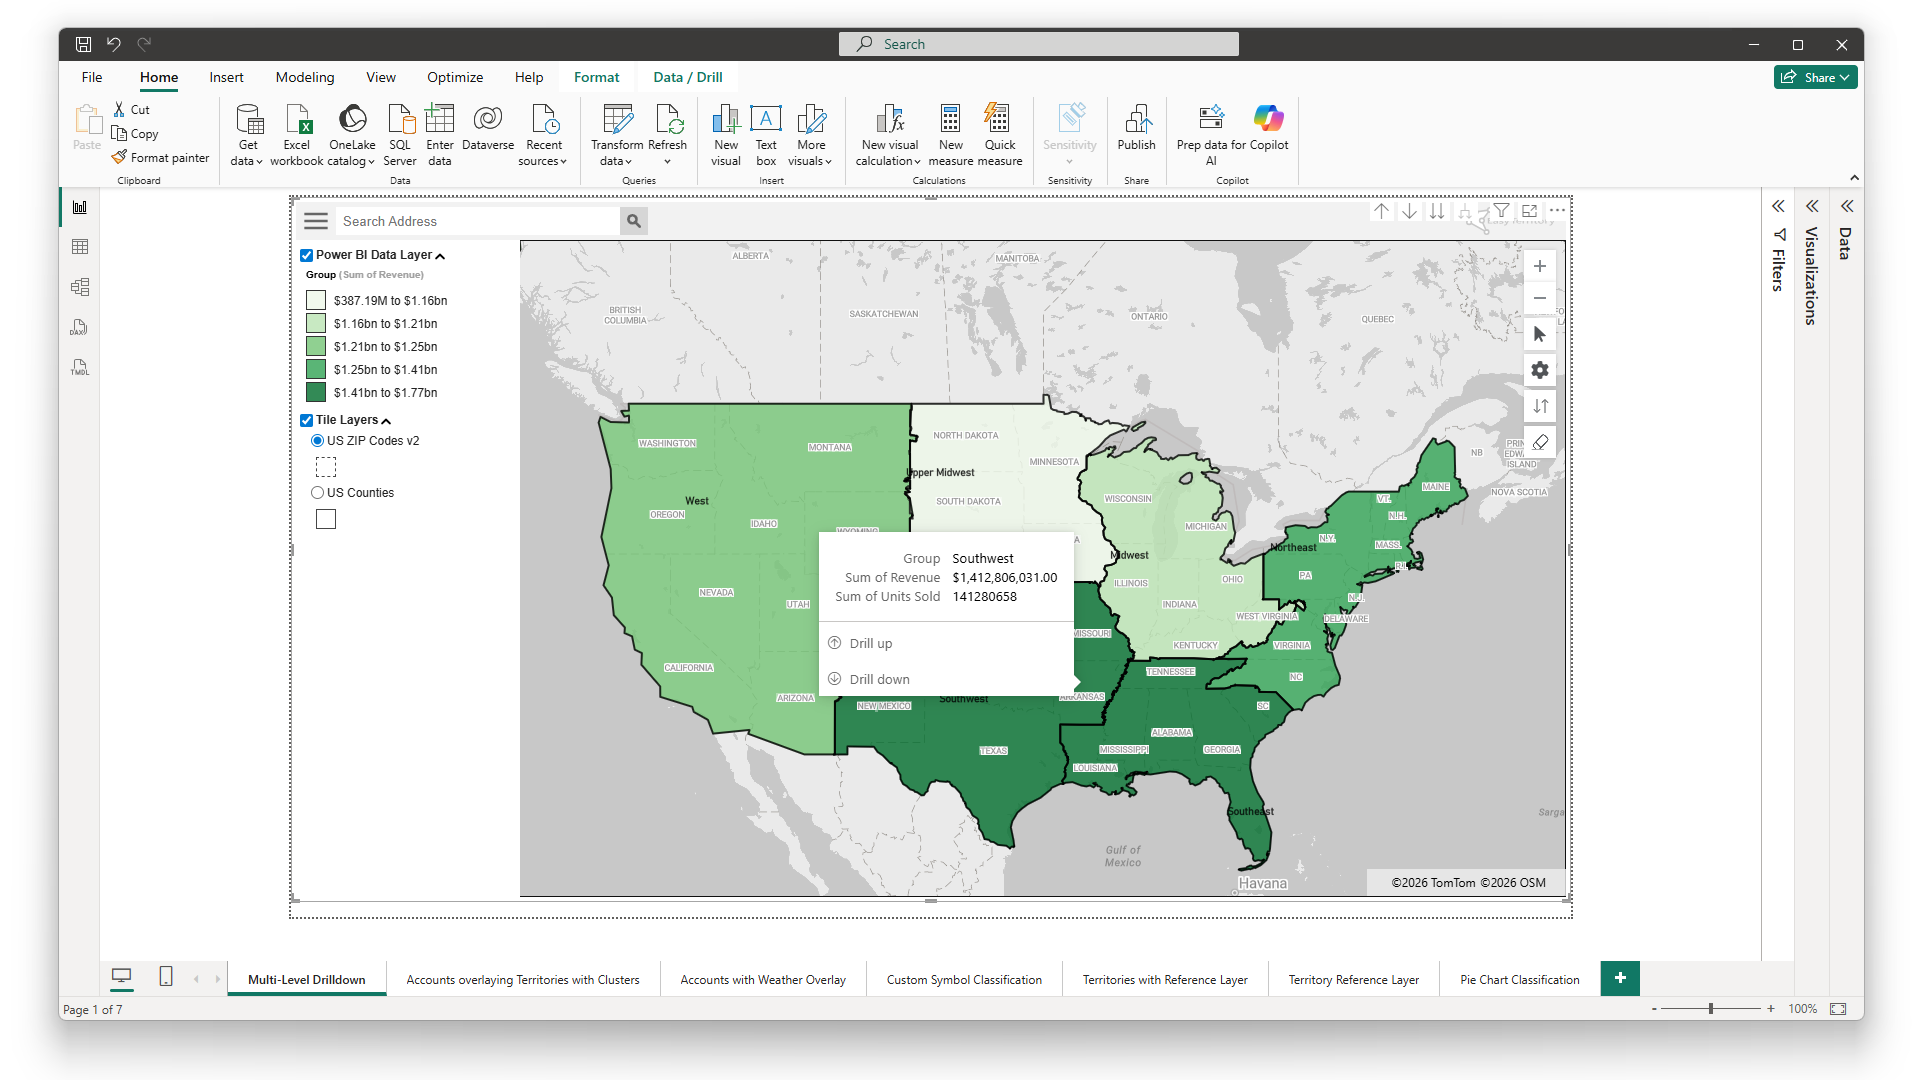
Empower your team with intelligent tools to explore their territory data with remarkable depth and precision. By leveraging Power BI’s native drill-down capabilities, you can seamlessly navigate through various levels of your territory hierarchy, from broad regions down to specific ZIP Codes or Postal Codes. This feature allows for a more granular analysis of localized geographic areas, enabling you to uncover detailed insights and trends that might be overlooked at a higher level. Whether you’re reviewing sales performance, identifying coverage gaps, or analyzing customer distribution, the Territory Drill Down functionality provides a clear, intuitive way to access the data you need. It enhances your ability to make informed decisions and optimize your strategies at every level of your territory structure.
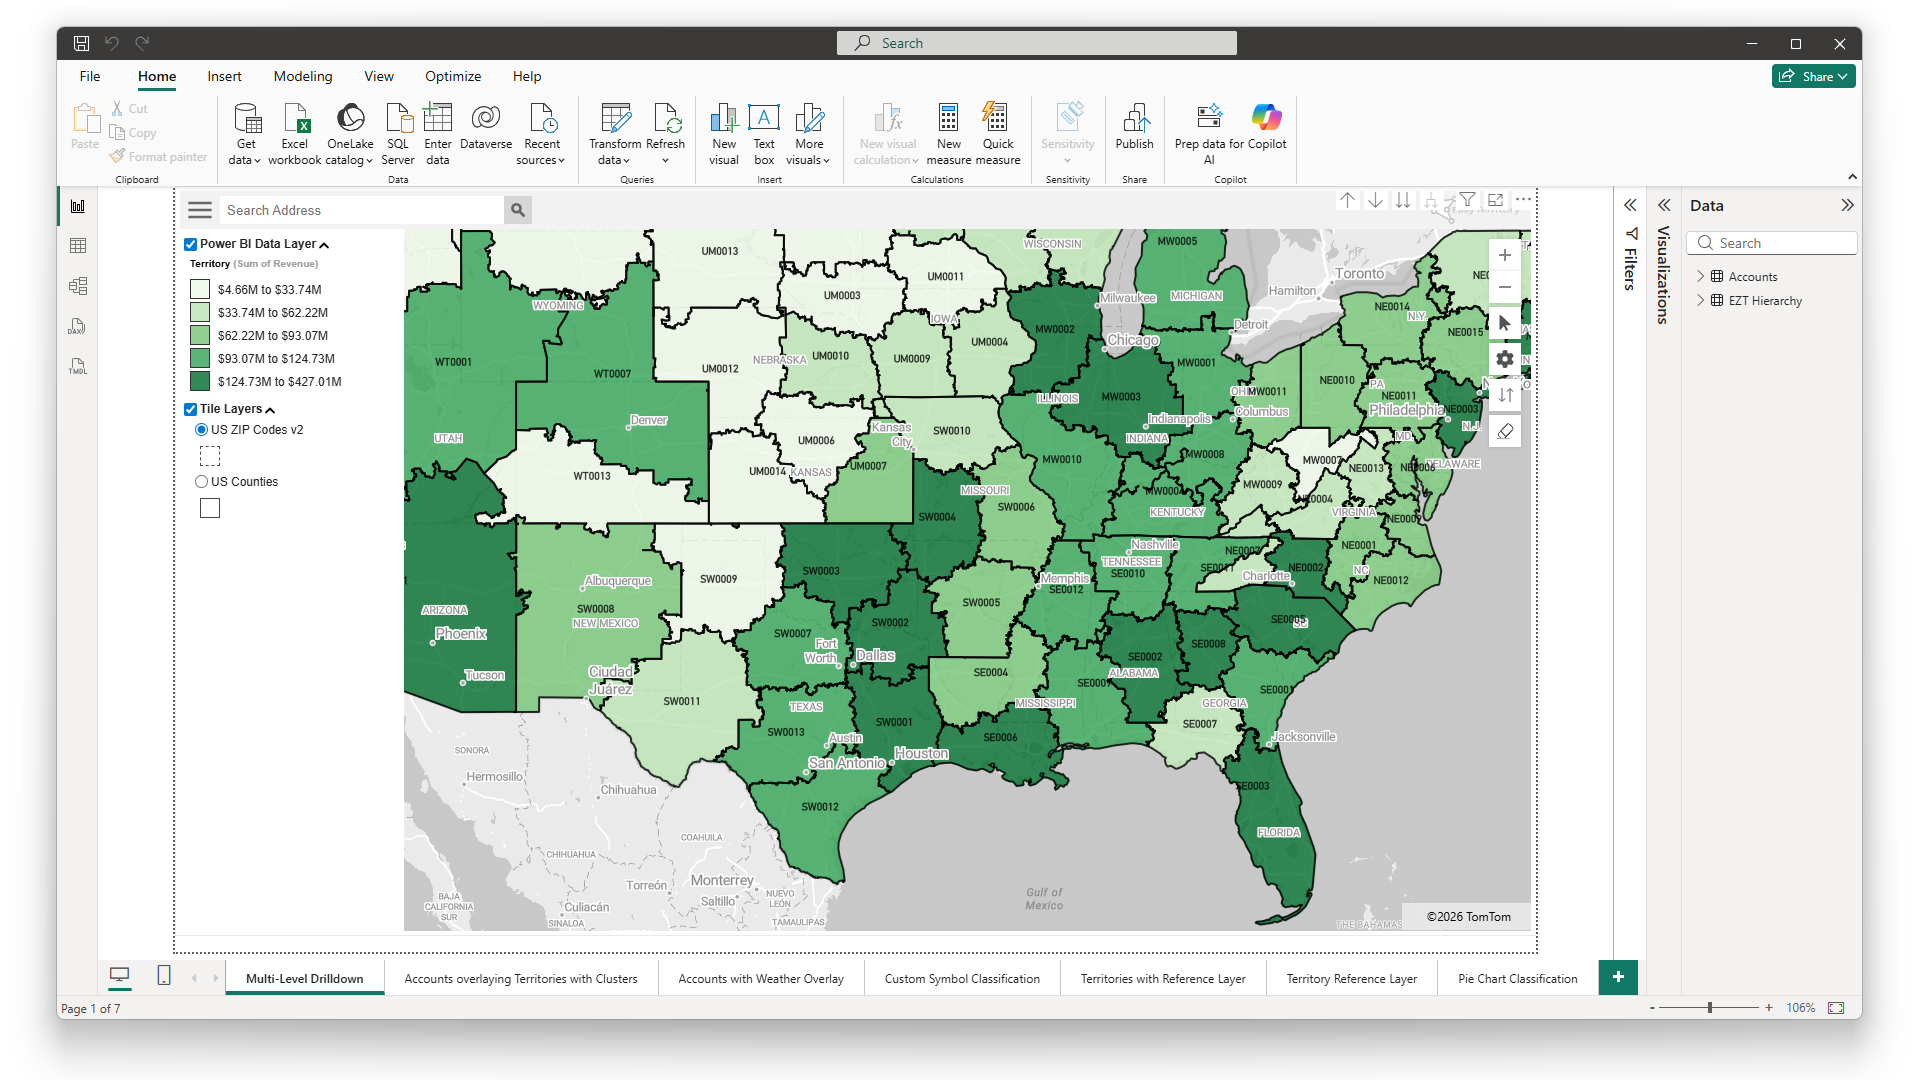
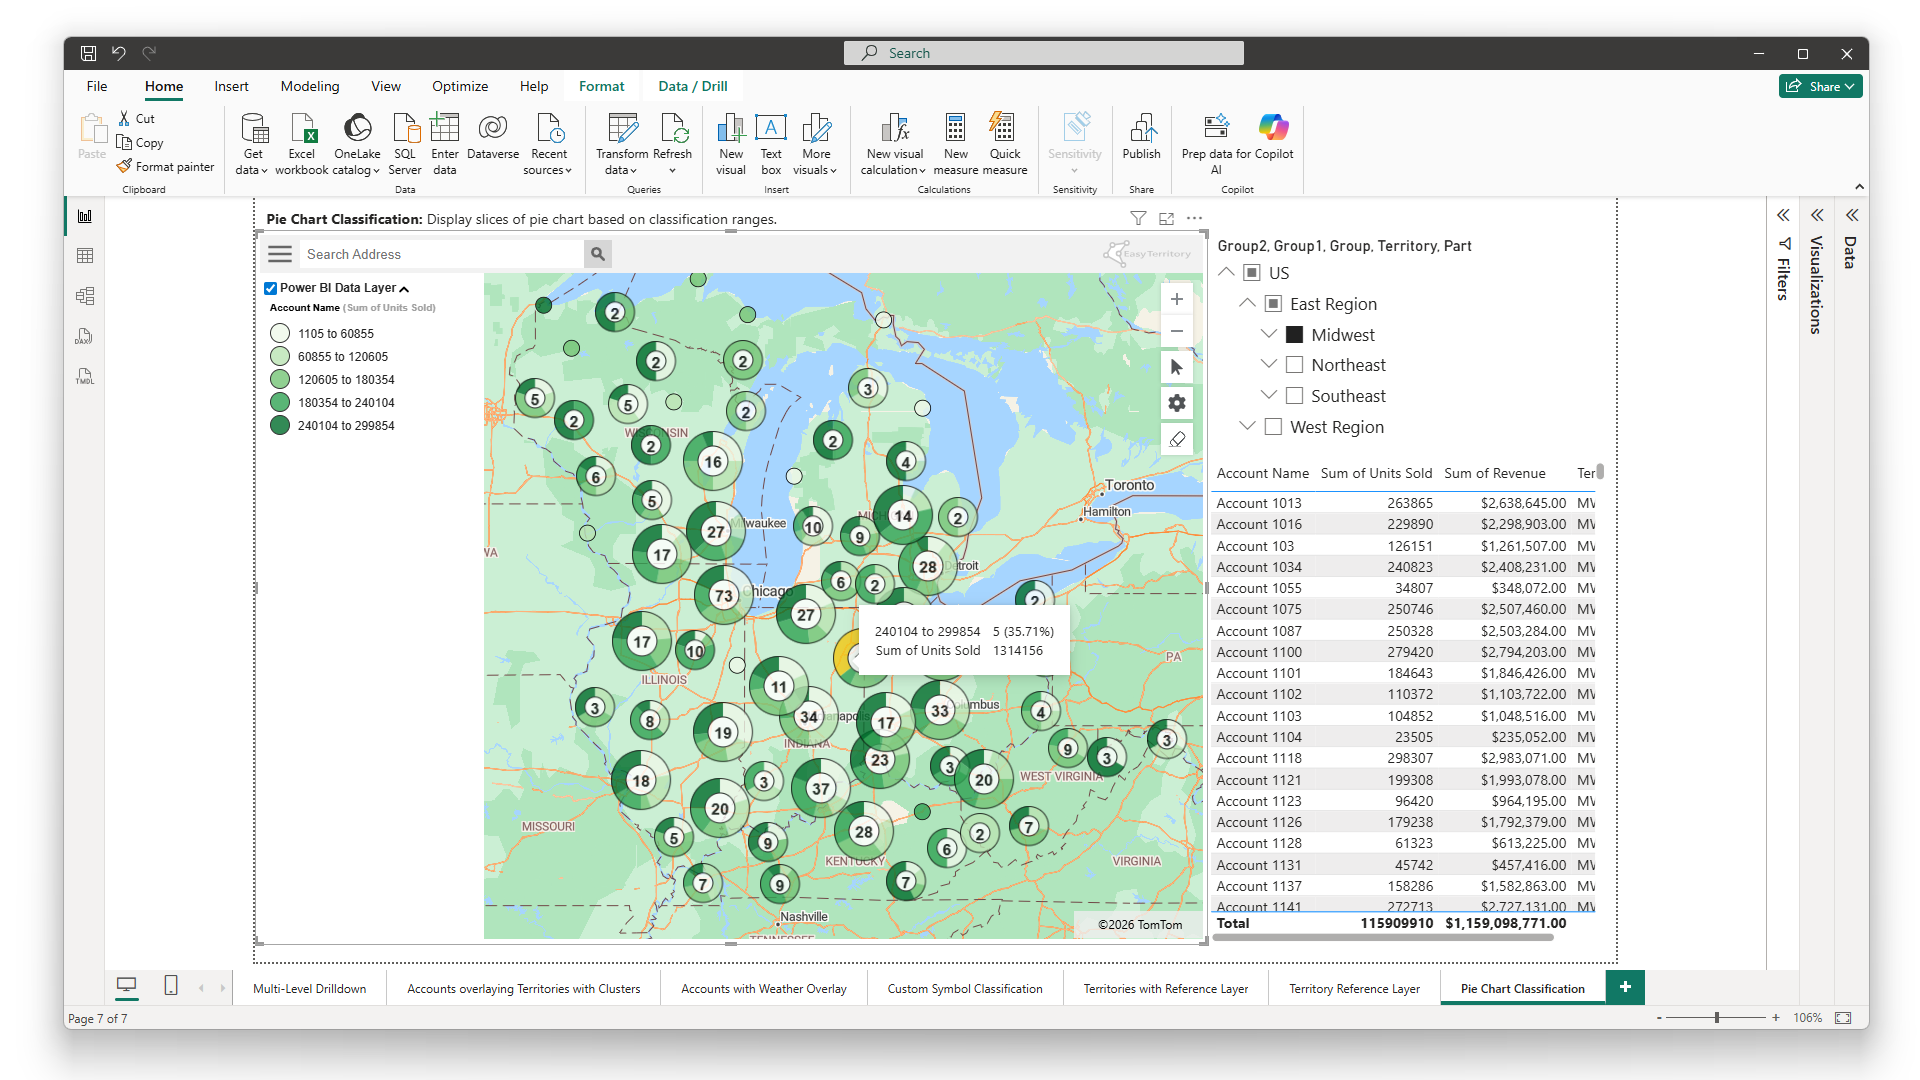
Heat Map Power BI Classification
Create visually striking heat maps that provide immediate insights into your regions and territories. This functionality allows you to color-code your mapped territories based on any metric from your Power BI data model, whether it’s sales performance, customer density, or resource allocation. These heat maps offer a powerful visual representation that makes it easy for executives and decision-makers to quickly grasp complex data patterns and trends. By translating raw data into intuitive color gradients, you can highlight areas of strength, identify regions that need attention, and communicate key insights with clarity and impact. The result is an enhanced ability to make data-driven decisions that align with your strategic goals.
Territory Lookup
Simplify the process of identifying the right sales or support representative for any given address. With just a quick search, you can instantly find the associated territory and the corresponding rep responsible for that location. This feature is particularly valuable for sales teams and customer support, as it eliminates the guesswork and manual effort involved in matching addresses to territories. Whether you’re looking to route a new lead, assign a customer query, or plan a visit, Territory Lookup ensures that you have the information you need at your fingertips, enhancing efficiency and ensuring that each customer is connected with the right representative quickly and accurately.
Travel-time Rings
Analyze distances and optimize your territory management. By leveraging Azure Maps travel-time rings, you can visually map out and assess how far your sales reps or service teams can travel within specific time frames. This feature allows you to filter postal codes or account data based on travel-time, providing a clear understanding of which customers or prospects are within reach. It’s an invaluable tool for planning efficient routes, optimizing territory coverage, and ensuring that your teams are focusing their efforts where they can have the most impact. With Travel-time Rings, you can make more informed decisions about resource allocation and improve overall service delivery.
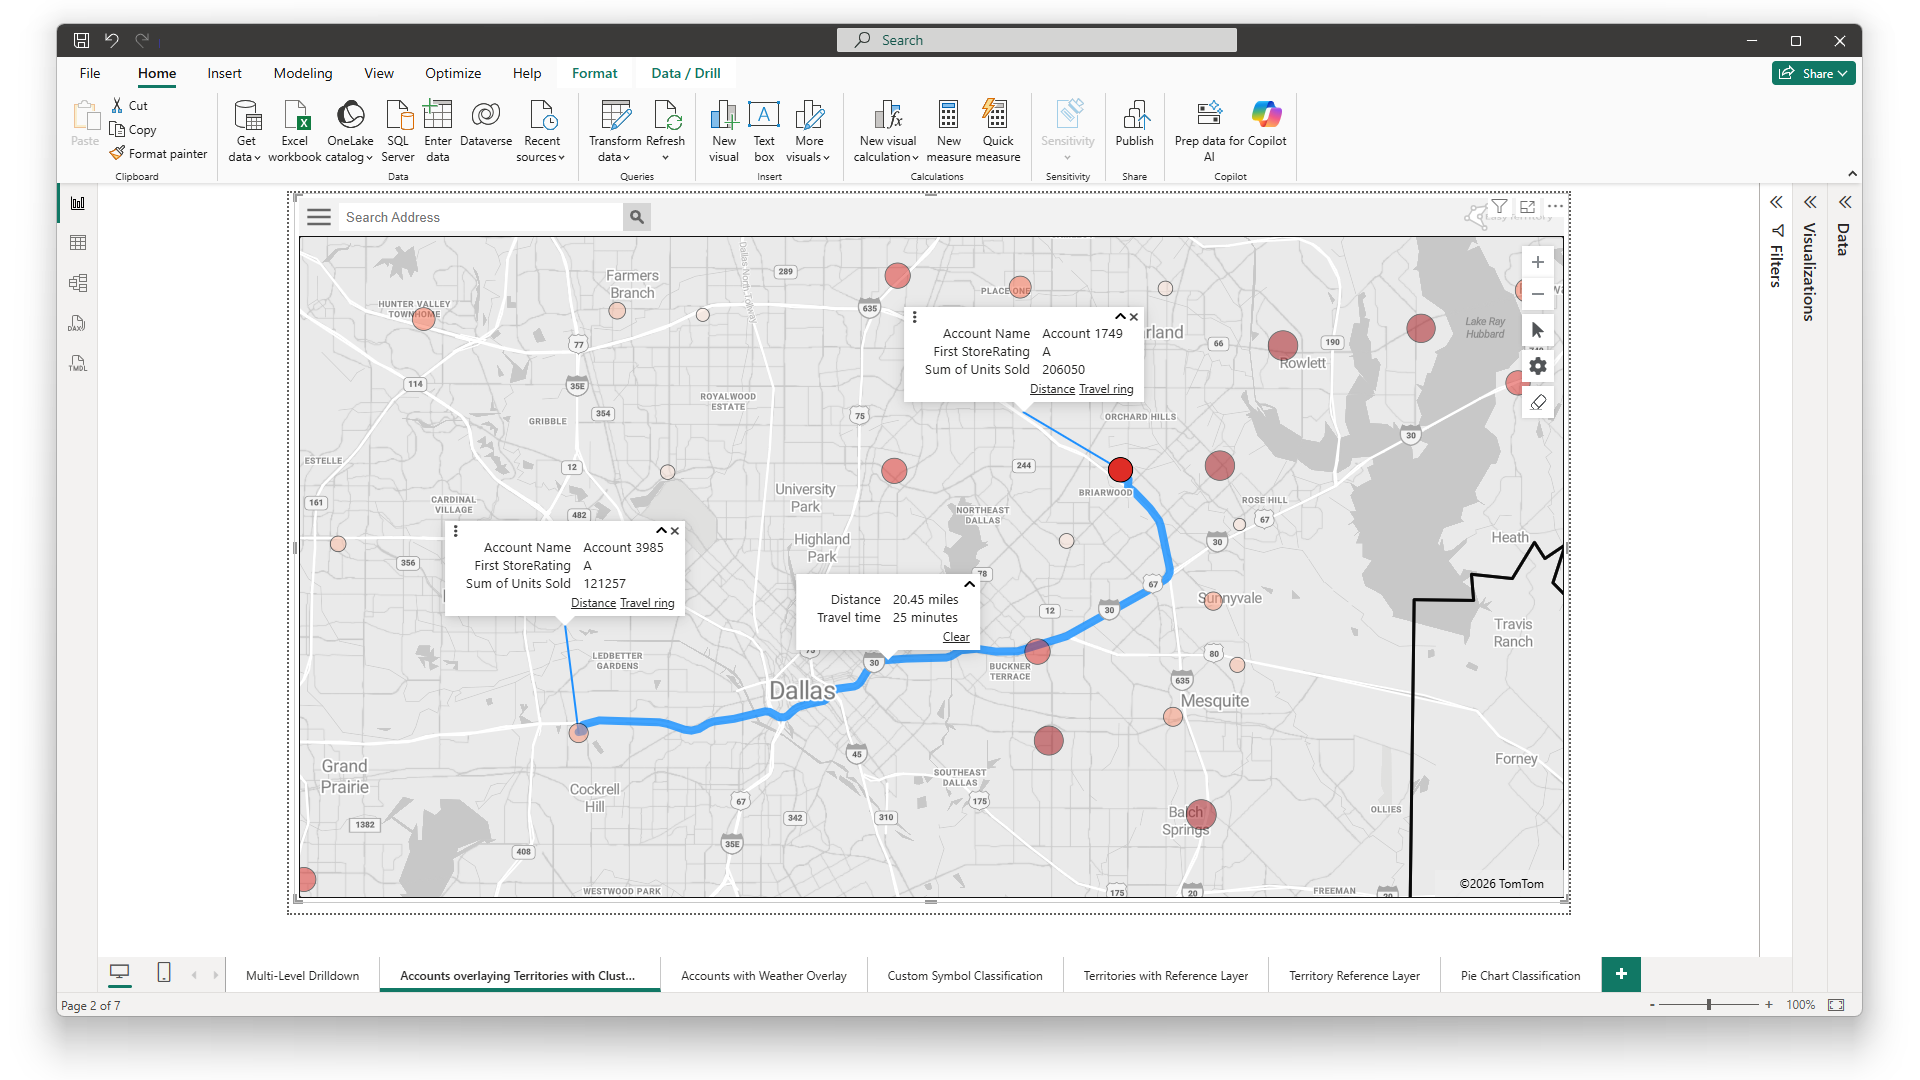
Point-to-Point Distance Calculation
The point-to-point distance calculation in our territory visual for Power BI leverages Azure Maps to accurately measure both straight-line distance and real-world driving time between two locations. By incorporating live road networks and routing intelligence, the visual provides a practical view of how far apart locations truly are, not just as the crow flies. This enables sales, service, and operations teams to better plan territories, optimize travel, and make informed scheduling decisions. With clear visibility into distance and drive time, users can confidently manage their routes, set realistic expectations, and—never be late to a meeting again.
Features of the Territory Visual for Power BI

Integrations with Territory Designer
Seamless editing and realignments in Territory Designer with support to publish directly to your Power BI report. This functionality is crucial for businesses that need to adapt to changing market conditions, sales strategies, or organizational growth. With the ability to make real-time adjustments to your territory boundaries, you can ensure that your sales and support teams are always aligned with the most current and effective territory structures. Whether you need to balance workloads, optimize coverage, or respond to shifts in customer demand, the Realign Territories feature gives you the flexibility and control to make precise adjustments, helping you maintain efficiency and effectiveness across your entire organization.

Postal Code (ZIP Code) Data
With EasyTerritory Enterprise, organizations are able to create comprehensive global territory maps using detailed geographic boundaries such as Postal Codes, counties, global states, or even entire countries. This feature allows you to leverage your existing Power BI data model to build these maps, ensuring that your territory management is precise and aligned with your specific business needs. By mapping out territories at such granular levels, you can gain deeper insights into regional performance, optimize your market coverage, and tailor your strategies to local conditions. Whether your business operates locally or globally, this feature provides the flexibility to design territory maps that reflect the true complexity of your market, helping you make more informed decisions and drive better results.

Azure Maps
Harness the power of high-performance mapping technology with global coverage. By integrating Azure Maps into your territory management, you gain access to detailed, reliable base maps that cover the entire world, ensuring that your geographic data is both accurate and comprehensive. This feature is essential for organizations that operate across multiple regions or countries, as it provides a consistent and robust mapping experience no matter where your territories are located. Whether you’re visualizing complex sales regions, planning logistics, or analyzing market penetration, Azure Maps offers the precision and clarity needed to make informed decisions on a global scale.

Power BI Gateway Configuration
By configuring the EasyTerritory Connector with the On-Premises Data Gateway, you can set up scheduled data refreshes in Power BI Service. This will ensure that the latest saved changes from your EasyTerritory project are applied to your Power BI data source. For more information on adding custom connectors to an on-premises data gateway, visit Microsoft’s documentation page.